
MATLAB: An Introduction with Applications
6th Edition
ISBN: 9781119256830
Author: Amos Gilat
Publisher: John Wiley & Sons Inc
expand_more
expand_more
format_list_bulleted
Related questions
Question

Transcribed Image Text:**Educational Content: Understanding Probability and Normal Distribution**
**Scenario:**
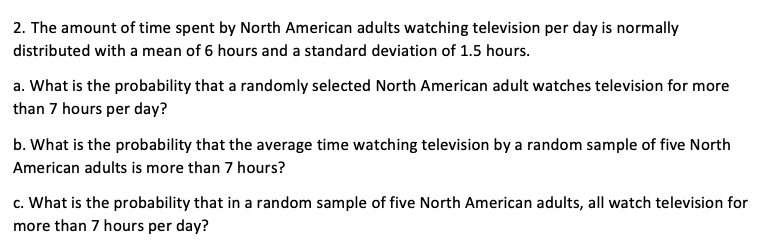
The amount of time spent by North American adults watching television per day is normally distributed with a mean of 6 hours and a standard deviation of 1.5 hours.
**Questions:**
**a. Individual Probability:**
What is the probability that a randomly selected North American adult watches television for more than 7 hours per day?
**b. Sample Mean Probability:**
What is the probability that the average time watching television by a random sample of five North American adults is more than 7 hours?
**c. Sample Total Probability:**
What is the probability that in a random sample of five North American adults, all watch television for more than 7 hours per day?
**Explanations:**
- **Normal Distribution:** The scenario is based on a normal distribution with specific parameters: mean (μ) = 6 hours, standard deviation (σ) = 1.5 hours.
- **Probabilities:** Calculating these probabilities typically involves using Z-scores and statistical tables or software to find the areas under the normal distribution curve.
**Diagrams:**
- While no diagrams are directly provided, typically for such a problem, a bell curve illustrating the normal distribution showing the mean at 6 and marking 7 on the x-axis would be used to visualize the probabilities requested in parts a, b, and c.
Expert Solution
This question has been solved!
Explore an expertly crafted, step-by-step solution for a thorough understanding of key concepts.

This is a popular solution

Trending nowThis is a popular solution!

Step by stepSolved in 4 steps with 5 images

Knowledge Booster

Similar questions
- A particular type of tennis racket comes in a midsize version and an oversize version. Sixty percent of all customers at a certain store want the oversize version. a. Among eight randomly selected customers who want this type of racket, what is the probability that at least six want the oversize version? b. Among eight randomly selected customers, what is the probability that the number who want the oversize version is within 1 standard deviation of the mean value?arrow_forward3. In preparation for the Olympics, an alpine skier is practicing a particular course. The amount of time it takes her to complete a single run of the course follows a normal distribution with a mean of 100 seconds and a standard deviation of 2 seconds. a. What is the probability it takes her more than 112.5 seconds to complete a single run of the course? b. The probability that she completes a run in less than seconds is equal to 0.0901. c. If she runs the course 9 times, what is the probability that her average time will be between 108.4 and 111.2 seconds?arrow_forward2. Suppose the length of time for a brunch at a restaurant is normally distributed with mean 60 minutes and standard deviation of 15 minutes. a. What is the probability that a randomly selected table takes less than 45 minutes? b. What is the probability inat a randomly selected table takes more than 30 minutes? c. What is the probability that a randomly selected table takes between 45 and 75 minutes? d. Find the amount of time that corresponds to the 99th percentile for brunch times. Find the amount of time, equidistant from the mean of 60 minutes, such that 90% of all brunch times are between these values. е.arrow_forward
- 6. The time until recharge for a battery in a laptop computer under common conditions is normally distributed with a mean of 260 minutes and a standard deviation of 50 minutes.a. What is the probability that a battery lasts more than four hours? b. What are the quartiles (the 25% and 75% values) of battery life? c. What value of life in minutes is exceeded with 95% probability?arrow_forward42. An automobile battery manufacturer claims their batteries have an average life of 5 years with a standard deviation of 1.3 years. Assuming battery life is normally distributed, what is the probability a random sample of 25 batteries has an average life between 4.7 and 5.5 years? 0.1515 0.8485 0.7590 0.2410arrow_forward9. The lengths of pregnancies are normally distributed with a mean of 266 days and a standard deviation of 15days. a. In a letter to an advice column, a wife claimed to have given birth 307 days after a brief visit from her husband, who was working in another country. Find the probability of a pregnancy lasting 307 days or longer. What does the result suggest? b. If the length of pregnancy is in the lowest 4%, then the baby is premature. Find the length that separates premature babies from those who are not considered premature.arrow_forward
- 10. Bags of grain in a warehouse have a mean weight of 60 pounds with a standard deviation of 4 pounds. a. In random samples of 36 bags, what is the probability the total weight of the bags is less than 2100 lb? b. In random samples of 36 bags, what is the 80th percentile for the total weight of the 36 bags?arrow_forwardAccording to CTIA, 41% of all U.S. households are wireless-only households (no landline). Choose four households at random. A. What is the probability that at least two will be wireless-only? B. What is the probability that none of them will be wireless-only? C. What is the probability that least 1 of them will be wireless-only? D. Find the mean and standard deviation for the number of households that are wireless-only.arrow_forwardThe number of sales that a car salesperson makes per month is normally distributed with mean 15 and standard deviation 4 . a. Find the probability that a randomly selected car salesperson will sell more than 14 cars this month.b. What is the average number of cars that a group of 25 sales people must sell to be in the 90thpercentile?arrow_forward
- 2. The number of pages in a PDF document you create has is randomly distributed between 5 and 9 pages, where all values are equally likely. What are the mean and standard deviation of the number of pages in the document2arrow_forward4. The average salary for first-year teachers is $27,989. Assume the distribution is approximately normal with standard deviation $3250. a. What is the probability that a randomly selected first-year teacher makes between $20,000 and $30,000 each year? b. What is the probability that a randomly selected first-year teacher has a salary less than $20,000?arrow_forward1.The number of chocolate chips in an 18 ounce bag of Chips Ahoy! chocolate chip cookies is approximately normally distributed with a mean 1262 and standard deviation of 118 chips according to a study by cadets at the U.S. Air Force Academy. a.What is the probability that a randomly selected 18 ounce bag of Chips Ahoy! Chocolate chip cookies contains between 1000 and 1400 chocolate chips? b.What is the probability that a randomly selected 18 ounce bag of Chips Ahoy! Chocolate chip cookies contains fewer than 1000 chocolate chips? c. What is the probability that a randomly selected 18 ounce bag of Chips Ahoy! Chocolate chip cookies contains more than 1400 chocolate chips?arrow_forward
arrow_back_ios
SEE MORE QUESTIONS
arrow_forward_ios
Recommended textbooks for you
- MATLAB: An Introduction with ApplicationsStatisticsISBN:9781119256830Author:Amos GilatPublisher:John Wiley & Sons Inc
 Probability and Statistics for Engineering and th...StatisticsISBN:9781305251809Author:Jay L. DevorePublisher:Cengage Learning
 Statistics for The Behavioral Sciences (MindTap C...StatisticsISBN:9781305504912Author:Frederick J Gravetter, Larry B. WallnauPublisher:Cengage Learning
  Elementary Statistics: Picturing the World (7th E...StatisticsISBN:9780134683416Author:Ron Larson, Betsy FarberPublisher:PEARSON
 The Basic Practice of StatisticsStatisticsISBN:9781319042578Author:David S. Moore, William I. Notz, Michael A. FlignerPublisher:W. H. Freeman
 Introduction to the Practice of StatisticsStatisticsISBN:9781319013387Author:David S. Moore, George P. McCabe, Bruce A. CraigPublisher:W. H. Freeman
MATLAB: An Introduction with Applications
Statistics
ISBN:9781119256830
Author:Amos Gilat
Publisher:John Wiley & Sons Inc
Probability and Statistics for Engineering and th...
Statistics
ISBN:9781305251809
Author:Jay L. Devore
Publisher:Cengage Learning
Statistics for The Behavioral Sciences (MindTap C...
Statistics
ISBN:9781305504912
Author:Frederick J Gravetter, Larry B. Wallnau
Publisher:Cengage Learning
Elementary Statistics: Picturing the World (7th E...
Statistics
ISBN:9780134683416
Author:Ron Larson, Betsy Farber
Publisher:PEARSON
The Basic Practice of Statistics
Statistics
ISBN:9781319042578
Author:David S. Moore, William I. Notz, Michael A. Fligner
Publisher:W. H. Freeman
Introduction to the Practice of Statistics
Statistics
ISBN:9781319013387
Author:David S. Moore, George P. McCabe, Bruce A. Craig
Publisher:W. H. Freeman