ENGR.ECONOMIC ANALYSIS
14th Edition
ISBN: 9780190931919
Author: NEWNAN
Publisher: Oxford University Press
expand_more
expand_more
format_list_bulleted
Question

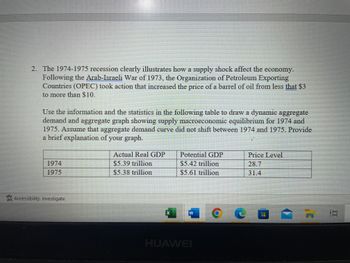
Transcribed Image Text:2. The 1974-1975 recession clearly illustrates how a supply shock affect the economy.
Following the Arab-Israeli War of 1973, the Organization of Petroleum Exporting
Countries (OPEC) took action that increased the price of a barrel of oil from less that $3
to more than $10.
Use the information and the statistics in the following table to draw a dynamic aggregate
demand and aggregate graph showing supply macroeconomic equilibrium for 1974 and
1975. Assume that aggregate demand curve did not shift between 1974 and 1975. Provide
a brief explanation of your graph.
Actual Real GDP
Potential GDP
Price Level
28.7
1974
$5.39 trillion
$5.42 trillion
1975
$5.38 trillion
$5.61 trillion
31.4
* Accessibility: Investigate
W
HUAWEI
Expert Solution
This question has been solved!
Explore an expertly crafted, step-by-step solution for a thorough understanding of key concepts.
This is a popular solution
Trending nowThis is a popular solution!
Step by stepSolved in 3 steps with 1 images

Knowledge Booster
Learn more about
Need a deep-dive on the concept behind this application? Look no further. Learn more about this topic, economics and related others by exploring similar questions and additional content below.Similar questions
- Question 76 During the 2020 campaign, Joe Biden proposed raising income taxes on those earning more than $400,000 per year and raising corporate taxes from about 21 percent to 28 percent. Consider the aggregate demand-aggregate supply diagram below, which represents the macroeconomy. Suppose the market is initially at an equilibrium at point A. What effect will a tax increase have on this graph? Question 76 options: 1.The long-run aggregate supply curve will shift to the left. 2.The aggregate demand curve will shift to the right. 3.The aggregate demand curve will shift to the left. 4.The short-run aggregate supply curve will shift to the left. Question 77 During the 2020 campaign, Joe Biden proposed raising income taxes on those earning more than $400,000 per year and raising corporate taxes from about 21 percent to 28 percent. Consider the market for money illustrated in the figure below. Assume the market initially is in equilibrium at point A. What effect will the tax increase…arrow_forward31) Use the dynamic model of aggregate demand and supply to illustrate a situation where aggregate demand and short-run aggregate supply are both increasing from year 1 to year 2, resulting in a higher price level and higher level of real GDP at macroeconomic equilibrium in year 2. 32) Hurricane Katrina resulted in a decline in oil production infrastructure along the gulf coast. As a result there was an unexpected decline in oil and natural gas supplies in 2005. Suppose that this caused an increase in the price level and a decline in real GDP in 2006. Also assume that potential real GDP continued to grow due to other factors. You can assume the aggregate demand curve did not change. Show the macroeconomic equilibrium for 2005 and 2006 using the dynamic aggregate supply and aggregate demand model. 1arrow_forwardDecide if the following events are Micro, shifting supply or demand, or Macro, shifting AD or AS. Give the direction in which the graph shifts. Aggregate Demand Supply Demand Situation Aggregate Supply Sales of Atlanta Braves gear grows with the success of the team. 1. The President and Congress pass a trillion dollar stimulus bill to provide aid during recession. 2. 3. Salmonella outbreak in peanut processing plants threatens lunches for school children. Pomegranates are shown to be cancer fighting superfoods. 4. Value of U.S. dollars declines, exports increase. 5. 6. Global oil prices tank as shale fracking surges. Housing market crashes. Federal 7. Reserve slashes interest rates. 8. House votes to block EPA regulations on coal fired electricity plants.arrow_forward
- Nonearrow_forwardSuppose that the aggregate demand and aggregate supply schedules for a hypothetical economy are as shown in the following table Amount of Price Level Amount of Real GDP (Price Index) Real GDP Demanded, Supplied, Billions Billions $100 300 $450 200 250 400 300 200 300 400 150 200 500 100 100 a. Use the data above to graph the agregate demand and aggregate supply curves. What are the…arrow_forwardq. Consider the following scenarios and briefly explain how each scenario would affect short-run aggregate supply (SAS), long-run aggregate supply (LAS) or aggregate demand (AD) in Canada. In some situations, more than one may be affected. 1. Canada produces larger number of university graduates who possess higher levels of education and skill. 2. Depletion of resources cause increase in the prices of key inputs in production. 3. Canada’s trading partners experience higher rates of economic growth. 4. Increase in oil prices raises the value of Canadian dollar.arrow_forward
arrow_back_ios
arrow_forward_ios
Recommended textbooks for you

 Principles of Economics (12th Edition)EconomicsISBN:9780134078779Author:Karl E. Case, Ray C. Fair, Sharon E. OsterPublisher:PEARSON
 Engineering Economy (17th Edition)EconomicsISBN:9780134870069Author:William G. Sullivan, Elin M. Wicks, C. Patrick KoellingPublisher:PEARSON
 Principles of Economics (MindTap Course List)EconomicsISBN:9781305585126Author:N. Gregory MankiwPublisher:Cengage Learning
 Managerial Economics: A Problem Solving ApproachEconomicsISBN:9781337106665Author:Luke M. Froeb, Brian T. McCann, Michael R. Ward, Mike ShorPublisher:Cengage Learning
 Managerial Economics & Business Strategy (Mcgraw-...EconomicsISBN:9781259290619Author:Michael Baye, Jeff PrincePublisher:McGraw-Hill Education


Principles of Economics (12th Edition)
Economics
ISBN:9780134078779
Author:Karl E. Case, Ray C. Fair, Sharon E. Oster
Publisher:PEARSON

Engineering Economy (17th Edition)
Economics
ISBN:9780134870069
Author:William G. Sullivan, Elin M. Wicks, C. Patrick Koelling
Publisher:PEARSON

Principles of Economics (MindTap Course List)
Economics
ISBN:9781305585126
Author:N. Gregory Mankiw
Publisher:Cengage Learning

Managerial Economics: A Problem Solving Approach
Economics
ISBN:9781337106665
Author:Luke M. Froeb, Brian T. McCann, Michael R. Ward, Mike Shor
Publisher:Cengage Learning

Managerial Economics & Business Strategy (Mcgraw-...
Economics
ISBN:9781259290619
Author:Michael Baye, Jeff Prince
Publisher:McGraw-Hill Education