MATLAB: An Introduction with Applications
6th Edition
ISBN: 9781119256830
Author: Amos Gilat
Publisher: John Wiley & Sons Inc
expand_more
expand_more
format_list_bulleted
Question

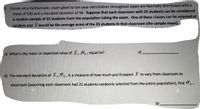
Transcribed Image Text:2. Scores on a mathematics exam given to ten-year-old children throughout Japan are Normally distributed with a
mean of 520 and a standard deviation of 50. Suppose that each classroom with 25 students can be considered
a random sample of 25 students from the population taking the exam. One of these classes can be selected at
random and X would be the average score of the 25 students in that classroom (the sample mean).
a)
a) What is the mean or expected value of X, H, equal to?
b) The standard deviation of X,0,, is a measure of how much you'd expect X to vary from classroom to
classroom (assuming each classroom had 25 students randomly selected from the entire population), find Oz.
b)

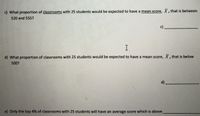
Transcribed Image Text:c) What proportion of classrooms with 25 students would be expected to have a mean score, X, that is between
520 and 555?
c)
d) What proportion of classrooms with 25 students would be expected to have a mean score, X, that is below
500?
d)
e) Only the top 4% of classrooms with 25 students will have an average score which is above
Expert Solution
This question has been solved!
Explore an expertly crafted, step-by-step solution for a thorough understanding of key concepts.
This is a popular solution
Trending nowThis is a popular solution!
Step by stepSolved in 2 steps with 3 images

Knowledge Booster
Similar questions
- As reported in "Runner's World" magazine, the times of the finishers in the New York City 10 km run are normally distributed with a mean of 61 minutes and a standard deviation of 9 minutes. Let x denote finishing time for the finishers. a) The distribution of the variable x has mean ____and standard deviation ___. b) The distribution of the standardized variable z has mean ___and standard deviation ____ c) The percentage of finishers with times between 40 and 75 minutes is equal to the area under the standard normal curve between ____ and ____ d) The percentage of finishers with times exceeding 80 minutes is equal to the area under the standard normal curve that lies to the ____ of _____arrow_forward1. The Boeing 727 airliner carries 200 passenger and has doors with a height of 72 inches. Height of men are normally distributed with a mean of 69.5 inches anda standard deviation of 2.4 inches. a) If a male passenger is randomly selected, find the probability that he can fhit through the doorway without bending b) If half of the 200 passengers are men, find the probability that the mean height of the 100 men is less than 72 inchesarrow_forward7) In a sample of 50 business trips taken by employees in the HR department, a company finds that the average amount spent for the trips was $1450 with a standard deviation of $450. In a sample of 90 trips taken by the employees in the sales department is $1650 with a standard deviation of $700. When testing the hypothesis that the average amount spent on trips taken by the sales department are higher than those taken by the HR department, if the test statistic is 2.05 and the critical value is 2.57 then what is your conclusion concerning the null hypothesis? select a) reject null hpyothesis or b) fail to reject null hypothesisarrow_forward
- 9. Women's heights are normally distributed with a mean of 63.8 in and standard deviation of 2.6 in. a) If one woman is randomly selected, find the probability that her height is less than 62.4 inches. b) If one woman is randomly selected, find the probability that her height is more than 64.5 inches. c) If one woman is randomly selected, find the probability that her height is between 61.0 inches and 68.0 inches. d) If 24 women are randomly selected, find the probability their mean height is less than 62.1 inches. e) Find P17.arrow_forward3. An article by S. M. Berry titled “Drive for Show and Putt for Dough (Chance, Vol 12(4), pg 50-54)” discussed driving distances of PGA players. The mean distance for tee shots on the 1999 men’s PGA tour is 272.2 yards with a standard deviation of 8.12 yards. Assuming that the 1999 tee-shot distances are normally distributed, find the percentage of such tee shots that went a. between 260 and 280 yards. b. more than 300 yards. 4. Do Exercise 6.103 on page 288 in the textbook. Show work. (image attached) 5. Refer to question 3 in this homework. The article “Drive for Show and Putt for Dough (Chance, Vol 12(4), pg 50-54)” discussed driving distances of PGA players. The mean distance for tee shots on the 1999 men’s PGA tour is 272.2 yards with a standard deviation of 8.12 yards. Assuming that the 1999 tee-shot distances are normally distributed answer the following questions: a. Determine the quartiles of the driving distances b. Find the 95th percentile. c. Obtain the third decile (i.e.…arrow_forward3. IQ scores are distributed approximately normally in the human population, with a mean of 100 and a standard deviation of 15. a) To belong to MENSA requires an IQ of 130. What percentage of the population are eligible to join? b) What is the probability the Kwantlen University College Underwater Singing Club, with 10 members, has a mean IQ of between 85 and 90?arrow_forward
- 5. A random sample of 50 medical school applicants at a university has a mean raw score of 31 on the multiple choice portions of the Medical College Admission Test (MCAT). A student claims that mean raw score for the for the school's applicants is more than 30. Assume the population standard deviation is 2.5. At a = 0.01, is there enough evidence to support the student's claim?arrow_forward2.)A machine automatically dispenses a beverage of a desired size. When set to "small," the machine dispenses varying amounts of liquid with a mean of 275275 mLmL and standard deviation of 1010 mLmL. Suppose that we take random samples of 55 of these drinks and calculate the mean amount of liquid ?¯x¯ in each sample. We can assume that individual drinks are independent. Calculate the mean and standard deviation of the sampling distribution of ?¯x¯.arrow_forwardThe U.S. Department of Transportation reported recently that all commuters in the New York City area average 120 minutes on the road travelling to and from work each workday. Assume that the standard deviation for the amount of time all commuters in the New York City area travel to and from work each workday equals 30 minutes. a) If a random sample of 36 commuters in the New York City area is selected, calculate the associated standard error of the mean.. b) What is the probability that mean travel time for the commuters in the sample is between 113.5 and 122.5 minutes?arrow_forward
- 6. Suppose that 100 females at a gym are randomly selected and asked their weights, in pounds. The mean is 137, the median is 125, and the standard deviation is approximately 23. What can you conclude? Read carefully and select one of the following: a) On average, each female's weight in the sample is approximately 23 pounds different from the mean. b) On average, each female's weight in the sample is approximately 23 pounds different from the median. c) On average, each female's weight in the sample is approximately 23% different from the mean. d) On average, each female’s weight in the sample is approximately 23% different from the median.arrow_forwardAnnouncements for 83 upcoming engineering conferences were randomly picked from a stack of IEEE Spectrum magazines. The mean length of the conferences was 3.96 days, with a standard deviation of 1.24 days. Assume the underlying population is normal. 1)In words define the random variables x and x̅ X is the mean length from a sample of 83 engineering conferences and x̅ is the length of an engineering conference. X is the length of an engineering conference and x̅ is the mean length from a sample of 83 engineering conferences. X is the number of engineering conferences and x̅ is the mean number of engineering conferences listed in IEEE spectrum magazine. X is the mean number of engineering conferences listed in IEEE spectrum magazine and x̅ is the number of engineering conferences. 2)Which distribution should you use for this problem? Explain your choice. The student’s t-distribution should be used because the sample mean is smaller than 30. The student’s t-distribution…arrow_forward3. A consumer electronics company is comparing the brightness of two different types of picture tubes for use in its television sets. Tube type A has mean brightness of 100 and standard deviation of 16, and tube type B has unknown mean brightness, but the standard deviation is assumed to be identical to that for type A. A random sample of n = 25 tubes of each type is selected, and X-X is computed. If equals or HB exceeds, the manufacturer would like to adopt type B for use. The observed difference is -₁ =3.0. What is the probability that by 3.0 or more if HB and HA are equal? exceedsarrow_forward
arrow_back_ios
SEE MORE QUESTIONS
arrow_forward_ios
Recommended textbooks for you
 MATLAB: An Introduction with ApplicationsStatisticsISBN:9781119256830Author:Amos GilatPublisher:John Wiley & Sons Inc
 Probability and Statistics for Engineering and th...StatisticsISBN:9781305251809Author:Jay L. DevorePublisher:Cengage Learning
 Statistics for The Behavioral Sciences (MindTap C...StatisticsISBN:9781305504912Author:Frederick J Gravetter, Larry B. WallnauPublisher:Cengage Learning
 Elementary Statistics: Picturing the World (7th E...StatisticsISBN:9780134683416Author:Ron Larson, Betsy FarberPublisher:PEARSON
 The Basic Practice of StatisticsStatisticsISBN:9781319042578Author:David S. Moore, William I. Notz, Michael A. FlignerPublisher:W. H. Freeman
 Introduction to the Practice of StatisticsStatisticsISBN:9781319013387Author:David S. Moore, George P. McCabe, Bruce A. CraigPublisher:W. H. Freeman

MATLAB: An Introduction with Applications
Statistics
ISBN:9781119256830
Author:Amos Gilat
Publisher:John Wiley & Sons Inc

Probability and Statistics for Engineering and th...
Statistics
ISBN:9781305251809
Author:Jay L. Devore
Publisher:Cengage Learning

Statistics for The Behavioral Sciences (MindTap C...
Statistics
ISBN:9781305504912
Author:Frederick J Gravetter, Larry B. Wallnau
Publisher:Cengage Learning

Elementary Statistics: Picturing the World (7th E...
Statistics
ISBN:9780134683416
Author:Ron Larson, Betsy Farber
Publisher:PEARSON

The Basic Practice of Statistics
Statistics
ISBN:9781319042578
Author:David S. Moore, William I. Notz, Michael A. Fligner
Publisher:W. H. Freeman

Introduction to the Practice of Statistics
Statistics
ISBN:9781319013387
Author:David S. Moore, George P. McCabe, Bruce A. Craig
Publisher:W. H. Freeman