
MATLAB: An Introduction with Applications
6th Edition
ISBN: 9781119256830
Author: Amos Gilat
Publisher: John Wiley & Sons Inc
expand_more
expand_more
format_list_bulleted
Related questions
Topic Video
Question
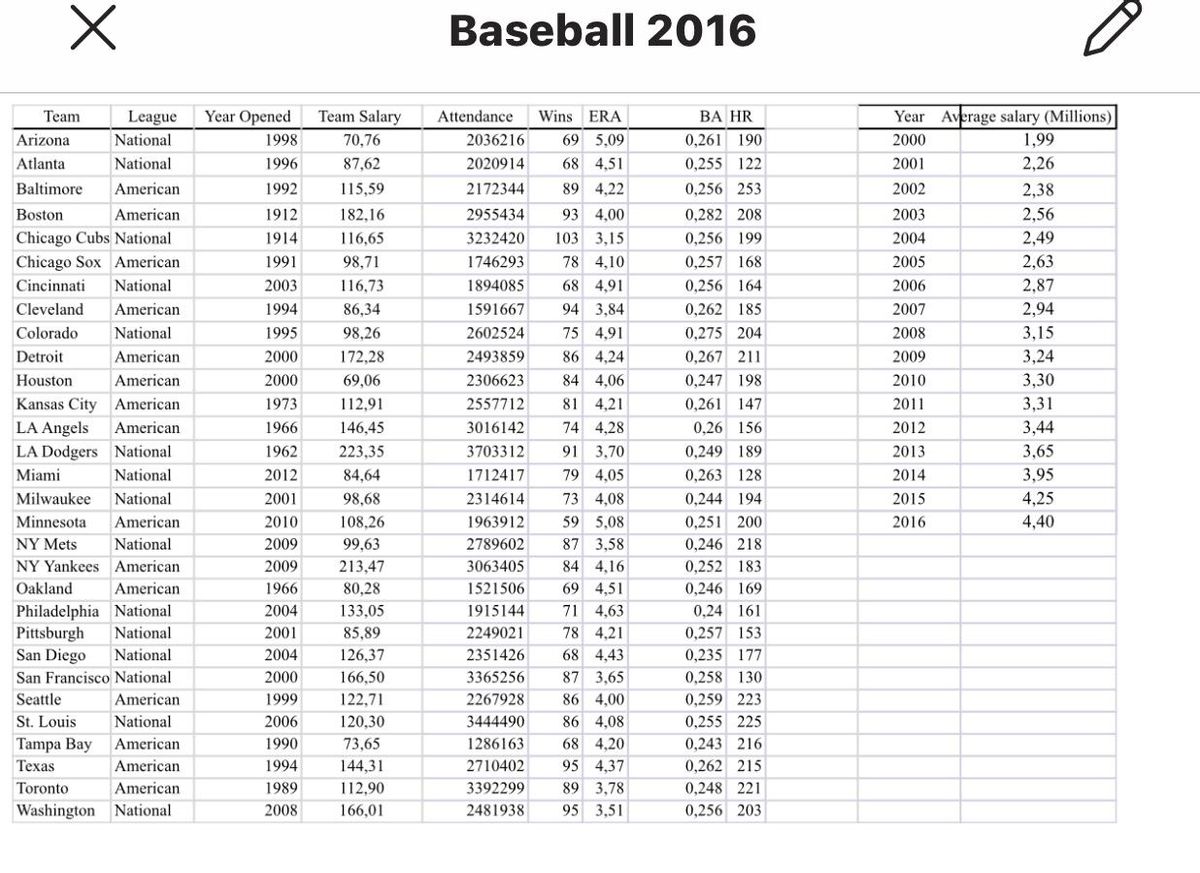

Transcribed Image Text:Baseball 2016
Year Average salary (Millions)
1,99
Team
League
Year Opened
ВА HR
Team Salary
70,76
Attendance
Wins ERA
Arizona
National
1998
2036216
69 5,09
0,261 190
2000
Atlanta
National
1996
87,62
2020914
68 4,51
0,255 122
2001
2,26
Baltimore
American
1992
115,59
2172344
89 4,22
0,256 253
2002
2,38
Boston
American
1912
182,16
2955434
93 4,00
0,282 208
2003
2,56
Chicago Cubs National
1914
116,65
3232420
103 3,15
0,256 199
2004
2,49
Chicago Sox American
1991
98,71
1746293
78 4,10
0,257 168
2005
2,63
2,87
2,94
Cincinnati
National
2003
116,73
1894085
68 4,91
0,256 164
2006
Cleveland
American
1994
86.34
1591667
94 3,84
0,262 185
2007
Colorado
National
1995
98,26
2602524
75 4,91
0,275 204
2008
3,15
Detroit
American
2000
172,28
2493859
86 4,24
0,267 211
2009
3,24
3,30
3,31
3,44
Houston
American
2000
69,06
2306623
84 4,06
0,247 198
2010
Kansas City American
1973
112,91
2557712
81 4,21
0,261 147
2011
LA Angels
LA Dodgers National
American
1966
146,45
3016142
74 4,28
0,26 156
2012
1962
223,35
3703312
91 3,70
0,249 189
2013
3,65
Miami
National
2012
84,64
1712417
79 4,05
0,263 128
2014
3,95
Milwaukee
National
2001
98,68
2314614
73 4,08
0,244 194
2015
4,25
Minnesota
American
2010
108,26
1963912
59 5,08
0,251 200
2016
4,40
NY Mets
National
2009
99,63
2789602
87 3,58
0,246 218
NY Yankees American
2009
213,47
3063405
84 4,16
0,252 183
Oakland
American
1966
80,28
1521506
69 4,51
0,246 169
Philadelphia National
Pittsburgh
San Diego
2004
133,05
1915144
71 4,63
0,24 161
National
2001
85,89
2249021
78 4,21
0,257 153
National
2004
126,37
2351426
68 4,43
0,235 177
San Francisco National
2000
166,50
3365256
87 3,65
0,258 130
Seattle
American
1999
122,71
2267928
86 4,00
0,259 223
St. Louis
National
2006
120,30
3444490
86 4,08
0,255 225
Tampa Bay
American
1990
73,65
1286163
68 4,20
0,243 216
Техas
American
1994
144,31
2710402
95 4,37
0,262 215
Toronto
American
1989
112,90
3392299
89 3,78
0,248 221
Washington National
2008
166,01
2481938
95 3,51
0,256 203

Transcribed Image Text:2. Refer to the Baseball 2016 data, which report
information on the 30 Major League Baseball teams for
the 2016 season.
a. Conduct a test of hypothesis to determine whether
the mean salary of the teams was different from
$100.0 million. Use the .05 significance level.
b. Using a 5% significance level, conduct a test of
hypothesis to determine whether the mean
attendance was more than 2,000,000 per team.
Expert Solution
This question has been solved!
Explore an expertly crafted, step-by-step solution for a thorough understanding of key concepts.

This is a popular solution

Trending nowThis is a popular solution!

Step by stepSolved in 4 steps

Knowledge Booster


Learn more about
Need a deep-dive on the concept behind this application? Look no further. Learn more about this topic, statistics and related others by exploring similar questions and additional content below.Similar questions
- 1. A marketing manager for a cell phone company claims that more than 35% of children aged 10 – 11 have cell phones. In a survey of 5000 randomly selected children ages 10 – 11, 1805 of them had cell phones. Based on the sample data, can you conclude that the manager's claim is true? Use a 1% level of significance. A. Compute the p-value. B. Make a decision. C. Interpret the results.arrow_forwardThe Bureau of Labor Statistics reports that the official unemployment rate for Black people was 10.4% and 4.7% for White people in February 2015. Select all correct answers for this question. O The samples of white and black people are independent. The explanatory variable is the unemployment rate. The response variable is the unemployment rate. The response variable is race.arrow_forward4. A college student is contemplating a possible career option. One factor that will influence his decision is the amount of money he is likely to make. He decides to look up the average salary of graduates in that profession. Which information would be more useful to him, the mean salary or the median salary? Why?arrow_forward
- UBS Wealth Management UK periodically ask their customers to evaluate their financial consultants and services. The higher the customer rating, the better the perceived service. The maximum rating is 7. Independent samples of two financial consultants are given below. Consultant A has 10 years' experience, Consultant B has 1 years' experience. Use α = 0.05 and test to see whether the consultant with more experience has the higher population mean service rating. Consultant A Consultant B N1 = 16 N2 = 10 Mean1 = 6.82 Mean2 = 6.25 S1= 0.64 S2 = 0.75 State the null and alternative hypothesis, Compute the value of the test statistic. What is the p-value? What is your conclusion?arrow_forward4 Ms. Lisa Monnin is the budget director for Nexus Media Inc. She would like to compare the daily travel expenses for the sales staff and the audit staff. She collected the following sample information. Sales ($) Audit ($) 125 137 147 162 136 142 128 107 130 141 141 108 140 At the 0.01 significance level, can she conclude that the mean daily expenses are greater for the sales staff than the audit staff? Click here for the Excel Data File 1. State the decision rule. (Round your answer to 3 decimal places.) Reject Ho if t> 2. Compute the pooled estimate of the population variance. (Round your answer to 2 decimal places.) Pooled variance 3. Compute the test statistic. (Round your answer to 3 decimal places.) Value of the test statistic 4. State your decision about the null hypothesis. (Click to select) Ho: H₂ Ha 5. Estimate the p-value. (Round your answers to 3 decimal places.) p-value (Click to select) Sales 125 137 147 162 136 142 Audit 128 107 130 141 141 108 140arrow_forwardA business reports that their average salary is over $91,000, the simple mean of the salaries listed in the chart. Alternatively, instead of a simple mean, the business could report the median, or the mode. Which would be the most useful to someone deciding whether to apply for an entry level job at this business? Job Number of Employees Salary Line workers 10 $30,000 Office manager 1 $45,000 CEO 1 $200,000 Select one: a. Simple mean is best b. Simple mean and median are nearly equal numerically. They are equally good for this purpose and better than the other options. O c. Simple mean and mode are equally good for this purpose and better than the other options. d. Median and mode are about equally good for this purpose and better than other options.arrow_forward
- Consider the relationship between p-values and significance levels. a. Explain why a value of z-statistic that is significant at the 1% level in a one-sided test is always significant at the 5% level. b. Explain why the reverse is not true. If something is significant at the 5% level in a one-sided test it is not necessarily significant at the 1% level.arrow_forwardPast studies have indicated that the percentage of smokers was estimated to be about 34%. Given the new smoking cessation programs that have been implemented, you now believe that the percentage of smokers has reduced. You randomly surveyed 1783 people and found that 553 smoke. Use a 0.05 significance level to test the claim that the percentage of smokers has reduced.arrow_forwardThe U.S. National Center for Health Statistics complies birth statistics and publishes the results in vital statistics of the United States. The Center has historically believed that the mean of all newborns in the U.S. has been no less than 6.95 pounds. A sample of babies is selected so that the center can revise its belief. The following birth weights, in pounds are recorded: 7.4, 6.0, 8.6, 4.5, 2.0, 7.9, 4.0, 2.6, 5.9, 7.3, 7.3, 7.0, 6.3, 8.1, 7.1, 7.3, 6.6, 5.2, 9.8, 8.0, 10.9, 6.5, 3.8, 5.0, 8.0 a). At 5% level of significance, do these data provide sufficient evidence to refute the Center’s belief? Your conclusion must be in terms of the P-Value as well as setting up a Rejection Region. You must show all necessary work. b). Which statistical distribution should be applied in this situation and why? Explain carefully.arrow_forward
arrow_back_ios
arrow_forward_ios
Recommended textbooks for you
- MATLAB: An Introduction with ApplicationsStatisticsISBN:9781119256830Author:Amos GilatPublisher:John Wiley & Sons Inc
 Probability and Statistics for Engineering and th...StatisticsISBN:9781305251809Author:Jay L. DevorePublisher:Cengage Learning
 Statistics for The Behavioral Sciences (MindTap C...StatisticsISBN:9781305504912Author:Frederick J Gravetter, Larry B. WallnauPublisher:Cengage Learning
  Elementary Statistics: Picturing the World (7th E...StatisticsISBN:9780134683416Author:Ron Larson, Betsy FarberPublisher:PEARSON
 The Basic Practice of StatisticsStatisticsISBN:9781319042578Author:David S. Moore, William I. Notz, Michael A. FlignerPublisher:W. H. Freeman
 Introduction to the Practice of StatisticsStatisticsISBN:9781319013387Author:David S. Moore, George P. McCabe, Bruce A. CraigPublisher:W. H. Freeman
MATLAB: An Introduction with Applications
Statistics
ISBN:9781119256830
Author:Amos Gilat
Publisher:John Wiley & Sons Inc
Probability and Statistics for Engineering and th...
Statistics
ISBN:9781305251809
Author:Jay L. Devore
Publisher:Cengage Learning
Statistics for The Behavioral Sciences (MindTap C...
Statistics
ISBN:9781305504912
Author:Frederick J Gravetter, Larry B. Wallnau
Publisher:Cengage Learning
Elementary Statistics: Picturing the World (7th E...
Statistics
ISBN:9780134683416
Author:Ron Larson, Betsy Farber
Publisher:PEARSON
The Basic Practice of Statistics
Statistics
ISBN:9781319042578
Author:David S. Moore, William I. Notz, Michael A. Fligner
Publisher:W. H. Freeman
Introduction to the Practice of Statistics
Statistics
ISBN:9781319013387
Author:David S. Moore, George P. McCabe, Bruce A. Craig
Publisher:W. H. Freeman