
ENGR.ECONOMIC ANALYSIS
14th Edition
ISBN: 9780190931919
Author: NEWNAN
Publisher: Oxford University Press
expand_more
expand_more
format_list_bulleted
Related questions
Question
Give exact answer without photo answer and take a like
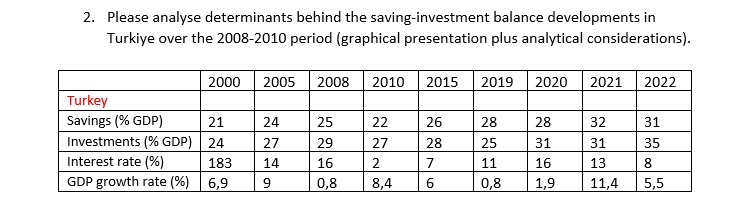

Transcribed Image Text:2. Please analyse determinants behind the saving-investment balance developments in
Turkiye over the 2008-2010 period (graphical presentation plus analytical considerations).
2000 2005 2008 2010 2015 2019 2020 2021
2022
Turkey
Savings (%GDP)
21
24
25
22
26
28
28
32
31
Investments (% GDP)
24
27
29
27
28
25
31
31
35
Interest rate (%)
183
14
16
2
7
11
16
13
8
GDP growth rate (%)
6,9
9
0,8
8,4
6
0,8
1,9
11,4
5,5
Expert Solution
This question has been solved!
Explore an expertly crafted, step-by-step solution for a thorough understanding of key concepts.

Step by stepSolved in 2 steps

Knowledge Booster

Similar questions
- Analyzing Business Cycles: Suppose that the coronavirus pandemic (COVID 19) in 2020 has resulted in a leftward shift of the aggregate demand curve (it has also shifted the short-run aggregate supply to the left, but let’s ignore this effect here for simplification). A. Use the aggregate-demand/aggregate-supply model to show the effects on output and the price level/inflation in both the short run and long run (assume that the short-run aggregate supply curve is upward sloping). B. Show the adjustment process of the economy from the short run to the long run. C.What is the effect on unemployment in short run and long run? D. Can policymakers use monetary policy (and/or fiscal policy) to accommodate this shock? Describe what happens to the economy in response to this policy action.arrow_forwardFactorise 5x -xa a. x(5-a) b. a(5x-1) c. 5(x-a) d. x(5-x)arrow_forwardFill in the table below, giving a numerical value for letters A, B, C, and D. TC AFC AVC 50 1 90 A B D 30 2.arrow_forward
arrow_back_ios
arrow_forward_ios
Recommended textbooks for you
 Principles of Economics (12th Edition)EconomicsISBN:9780134078779Author:Karl E. Case, Ray C. Fair, Sharon E. OsterPublisher:PEARSON
 Engineering Economy (17th Edition)EconomicsISBN:9780134870069Author:William G. Sullivan, Elin M. Wicks, C. Patrick KoellingPublisher:PEARSON
 Principles of Economics (MindTap Course List)EconomicsISBN:9781305585126Author:N. Gregory MankiwPublisher:Cengage Learning
 Managerial Economics: A Problem Solving ApproachEconomicsISBN:9781337106665Author:Luke M. Froeb, Brian T. McCann, Michael R. Ward, Mike ShorPublisher:Cengage Learning
 Managerial Economics & Business Strategy (Mcgraw-...EconomicsISBN:9781259290619Author:Michael Baye, Jeff PrincePublisher:McGraw-Hill Education
Principles of Economics (12th Edition)
Economics
ISBN:9780134078779
Author:Karl E. Case, Ray C. Fair, Sharon E. Oster
Publisher:PEARSON
Engineering Economy (17th Edition)
Economics
ISBN:9780134870069
Author:William G. Sullivan, Elin M. Wicks, C. Patrick Koelling
Publisher:PEARSON
Principles of Economics (MindTap Course List)
Economics
ISBN:9781305585126
Author:N. Gregory Mankiw
Publisher:Cengage Learning
Managerial Economics: A Problem Solving Approach
Economics
ISBN:9781337106665
Author:Luke M. Froeb, Brian T. McCann, Michael R. Ward, Mike Shor
Publisher:Cengage Learning
Managerial Economics & Business Strategy (Mcgraw-...
Economics
ISBN:9781259290619
Author:Michael Baye, Jeff Prince
Publisher:McGraw-Hill Education