
A First Course in Probability (10th Edition)
10th Edition
ISBN: 9780134753119
Author: Sheldon Ross
Publisher: PEARSON
expand_more
expand_more
format_list_bulleted
Related questions
Question
Listed below are recorded speeds (in km/hr) of randomly selected cars travelling on a section of SCTEX.That part of the express way has posted an average speed limit of 100 km/hr. Use a 0.01 significance level tot testthe claim that the vehicles do not exceed or is travelling at most the speed limit.
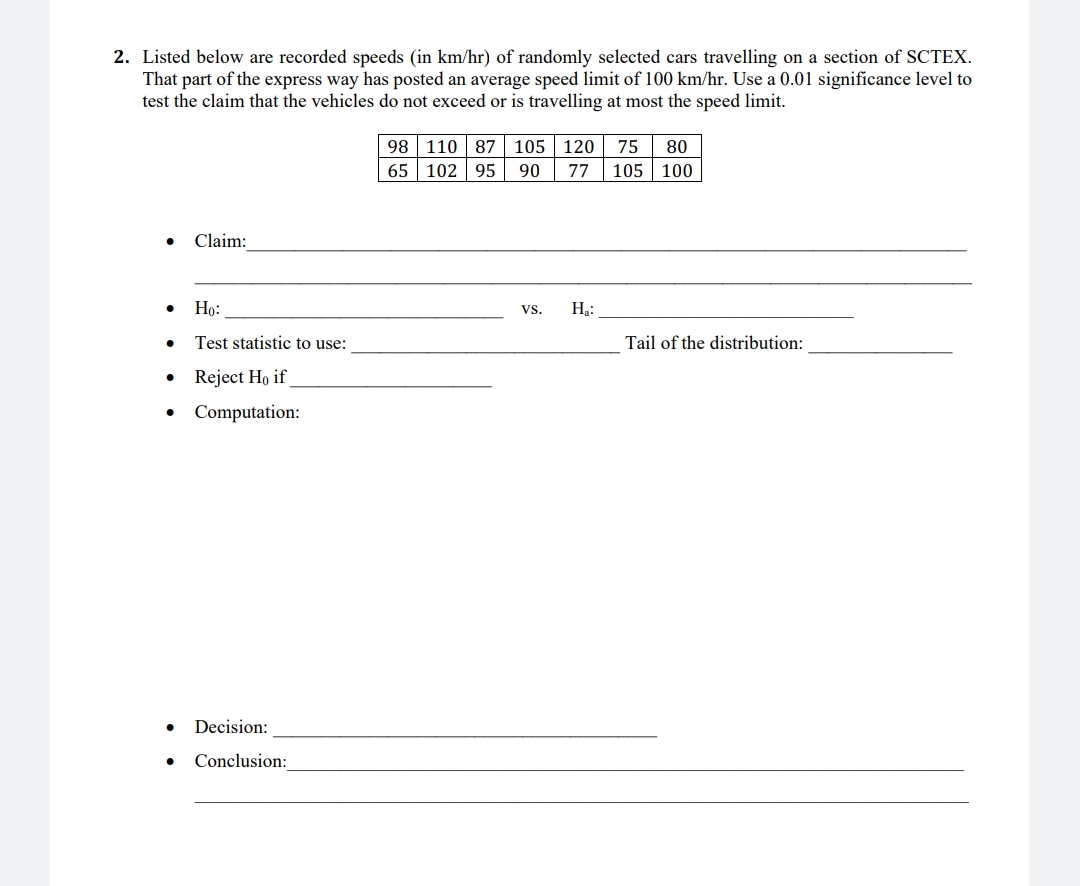

Transcribed Image Text:2. Listed below are recorded speeds (in km/hr) of randomly selected cars travelling on a section of SCTEX.
That part of the express way has posted an average speed limit of 100 km/hr. Use a 0.01 significance level to
test the claim that the vehicles do not exceed or is travelling at most the speed limit.
98 110 87 105 120
65 102 | 95
75
80
90
77
105 100
Claim:
Но:
vs.
H:
Test statistic to use:
Tail of the distribution:
Reject Ho if
Computation:
Decision:
Conclusion:
Expert Solution
This question has been solved!
Explore an expertly crafted, step-by-step solution for a thorough understanding of key concepts.

This is a popular solution

Trending nowThis is a popular solution!

Step by stepSolved in 2 steps with 9 images

Knowledge Booster

Similar questions
- Suppose that on a certain section of I-95, with a posted speed limit of 65 miles per hour, the speeds of all vehicles have a bell-shaped distribution with a mean of 72 mph and a standard deviation of 3 mph. Find the percentage of vehicles with the following speeds on this section of I-95: greater than 75 mph.arrow_forwardPlease answer the following: You can use the graphing calculator-just explain how to input into calculator. A tire manufacturer beleives that the tread life of its snow tires can be described by a normal model with a mean of 32,000 miles and standard deviation of 2,500 miles. a) If you buy a set of these tires, would it be reasonable for you to hope that they last 40,000 miles? Explain. b) What proportion of these tires can be expected to last less than 30,000 miles? c) What proportion of these tires can be expected to last between 30,000 and 35,000 miles? d) Estimate the IQR of the tread lives. e) In planning a marketing strategy, a local tire dealer wants to offer a refund to any customer whose tires fail to last a certain number of miles. However, the dealer does not want to take too big a risk. If the dealer is willing to give refunds to no more than 1 of every 25 customers, for what mileage can he be guaranteed these tires to last?arrow_forwardSuppose that a customer is purchasing a car. He conducts an experiment in which he puts 10 gallons of gas in the car and drives it until it runs out of gas. He conducts this experiment 15 Sample mean for Car 2 x= 245 mi / 10 gal (Type an integer or decimal rounded to one decimal place as needed.) times on each car and records the number of miles driven. Full data set Car 1 Median for Car 1 M= mi / 10 gal (Type an integer or decimal rounded to one decimal place as needed.) 245 242 215 244 220 265 291 160 284 251 169 319 257 306 267 Car 2 Median for Car 2 230 242 M=O mi / 10 gal 206 214 236 256 245 255 241 264 (Type an integer or decimal rounded to one decimal place as needed.) 276 252 250 251 257arrow_forward
- Please answer the following question by stating conditions and test required. Please show how to answer using graphing calculator if possible.arrow_forwardSuppose that on a certain section of I-95, with a posted speed limit of 65 miles per hour, the speeds of all vehicles have a bell-shaped distribution with a mean of 72 mph and a standard deviation of 3 mph. Find the percentage of vehicles with the following speeds on this section of I-95: greater than 75 mph. Use the Empirical Rule. Suppose that on a certain section of I-95, with a posted speed limit of 65 miles per hour, the speeds of all vehicles have a bell-shaped distribution with a mean of 72 mph and a standard deviation of 3 mph. Find the percentage of vehicles with the following speeds on this section of I-95: greater than 75 mph. Use the Empirical Rule. 81.5% 16% 32% 34% 50%arrow_forwardUse a z-table such as https://www.math.arizona.edu/~rsims/ma464/standardnormaltable.pdf or an online calculator such as http://onlinestatbook.com/2/calculators/normal_dist.html to answer the following question: This question again refers to the study on blood pressure. What proportion of the population has a blood pressure that is below the value 101.3 mmHg for a normally-distributed set of blood pressures with a mean of 120.1 mmHg and a standard deviation of 15.1 mmHg? Express your answer as a percentage rounded off to 1 decimal place. For the value from the previous question you just answered, what percentage of the population would have a blood pressure higher than this value? Express your answer as a percentage rounded to 1 decimal place and show your calculations below.arrow_forward
arrow_back_ios
arrow_forward_ios
Recommended textbooks for you
- A First Course in Probability (10th Edition)ProbabilityISBN:9780134753119Author:Sheldon RossPublisher:PEARSON

A First Course in Probability (10th Edition)
Probability
ISBN:9780134753119
Author:Sheldon Ross
Publisher:PEARSON