
MATLAB: An Introduction with Applications
6th Edition
ISBN: 9781119256830
Author: Amos Gilat
Publisher: John Wiley & Sons Inc
expand_more
expand_more
format_list_bulleted
Related questions
Concept explainers
Question
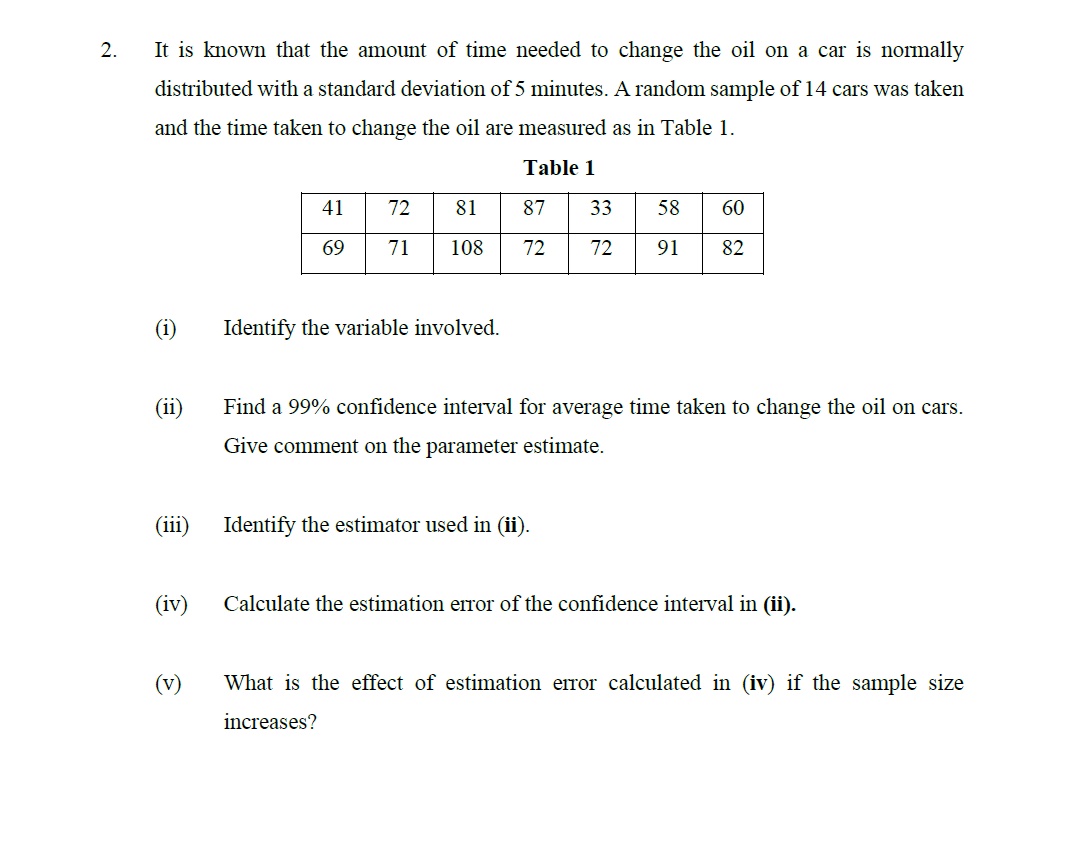

Transcribed Image Text:2.
It is known that the amount of time needed to change the oil on a car is normally
distributed with a standard deviation of 5 minutes. A random sample of 14 cars was taken
and the time taken to change the oil are measured as in Table 1.
Table 1
41
72
81
87
33
58
60
69
71
108
72
72
91
82
(i)
Identify the variable involved.
(ii)
Find a 99% confidence interval for average time taken to change the oil on cars.
Give comment on the parameter estimate.
(111)
Identify the estimator used in (ii).
(iv)
Calculate the estimation eror of the confidence interval in (ii).
(v)
What is the effect of estimation error calculated in (iv) if the sample size
increases?
Expert Solution
This question has been solved!
Explore an expertly crafted, step-by-step solution for a thorough understanding of key concepts.

This is a popular solution

Trending nowThis is a popular solution!

Step by stepSolved in 4 steps

Knowledge Booster


Learn more about
Need a deep-dive on the concept behind this application? Look no further. Learn more about this topic, statistics and related others by exploring similar questions and additional content below.Similar questions
- Some college graduates employed full-time work more than 40 hours per week, and some work fewer than 40 hours per week. We suspect that the mean number of hours worked per week by college graduates, u, is different from 40 hours and wish to do a statistical test. We select a random sample of college graduates employed full-time and find that the mean of the sample is 44 hours and that the standard deviation is 4 hours. Based on this information, answer the questions below.arrow_forwardBlood sugars from eight patients in a rural clinic were recorded last summer by the local physician. The blood sugars results were: 120, 145, 200, 250, 79, 100, 894, 255 mg/d1. The standard deviation was 5. Calculate the 95% Confidence Interval (CI) of the mean blood sugars.arrow_forwardThe seasonal output of a new experimental strain of pepper plants was carefully weighed. The mean weight per plant is 17.0 pounds, and the standard deviation of the normally distributed weights is 1.75 pounds. Of the 200 plants in the experiment, how many produced peppers weighing between 13 and 16 pounds?arrow_forward
- Suppose that the daily intake of an adult follows a uniform distribution from 40 to 65 micrograms. Suppose that 36 adults are randomly selected. What is the mean and standard deviation of the average intake for 36 adults. a. Mean= 52.5 stvdev = 1.2 b. Mean = 55 stvdev= 7.22c. Mean = 52.5 stvdev = 2.08 d. Mean= 52.5 stvdev = 7.22arrow_forwardSuppose that water usages in American showers are normally distributed, with an average shower using 20 gallons, and a standard deviation of 3.2 gallons. Estimate the percentage of showers that used (a) between 13.6 and 26.4 gallons. % (b) more than 26.4 gallons. % (c) less than 10.4 gallons. % (d) between 16.8 and 29.6 gallons. %arrow_forwardOn average, a banana will last 6.3 days from the time it is purchased in the store to the time it is too rotten to eat. The standard deviation is 2.1 days. Will the average banana spoil earlier if the banana is hung from the ceiling? The data show results of an experiment with 16 bananas that are hung from the ceiling. Assume that that distribution of the population is normal. 5, 8, 5, 7, 4, 4, 6, 8, 6, 7, 5, 7, 6, 3, 6,2 What can be concluded at the 0.10 level of significance? H0: = 6.3 Ha: [ Select ] [">", "<", "Not Equal To"] 6.3 Test statistic:[ Select ] ["T", "Z"] p-Value = [ Select ] ["0.02", "0.08", "0.04", "0.16"] [ Select ] ["Reject Ho", "Fail to Reject Ho"] Conclusion: There is [ Select ] ["insufficient", "statistically significant"] evidence to make the conclusion that the population mean time that it takes for bananas to spoil if they are hung from the ceiling is less than 6.3 days.arrow_forward
- On a measure of running speed on a 100 meter dash, students received timed scores ranging from 12 seconds to 24 seconds. The distribution of running times is normative with a mean of 16 seconds. Transferring this ratio data to standard scores for comparison with the results of classes from other departments, the mean score is assigned a standard score of 100 with a standard deviation of 10. From this example, a standard score of 99 would mean the actual value in seconds for an individual would be about a. 16 b. 12 c. 19 d. 24arrow_forwardThe breaking strengths of cables produced by a certain manufacturer have historically had a mean of 1775 pounds and a standard deviation of 70 pounds. The Español company believes that, due to an improvement in the manufacturing process, the mean breaking strength, µ, of the cables is now greater than 1775 pounds. To see if this is the case, 16 newly manufactured cables are randomly chosen and tested, and their mean breaking strength is found to be 1806 pounds. Assume that the population is normally distributed. Can we support, at the 0.10 level of significance, the claim that the population mean breaking strength of the newly- manufactured cables is greater than 1775 pounds? Assume that the population standard deviation has not changed. Perform a one-tailed test. Then complete the parts below. 00 Carry your intermediate computations to three or more decimal places, and round your responses as specified below. (If necessary, consult a list of formulas.) (a) State the null hypothesis H,…arrow_forwardThe manager of a fleet of automobiles is testing two brands of radial tires and assigns one tire of each brand at random to the two rear wheels of eight cars and runs the cars until the tires wear out. The data (in kilometers) follow. Find a 99% confidence interval on the difference in the mean life. Car Brand 1 Brand 2 1 36,925 34,318 2 45,300 42,280 3 36,256 35.548 4 32,100 31,950 5 37,210 38,015 6 48,360 47,800 7 38.200 37,810 8 33,500 33,215 Round your answer to 2 decimal places. Do not use commas.arrow_forwardIn a certain country the heights of adult men are normally distributed with a mean of 70.2 inches and a standard deviation of 2.7 inches. The country's military requires that men have heights between 66 inches and 79 inches. Determine what percentage of this country's men are eligible for the military based on height. The percentage of men that are eligible for the military based on height is nothing%. (Round to two decimal places as needed.)arrow_forwardRhys is a quality control manager at a facility that manufactures snack foods. He is interested in the number of whole mini- pretzels that are in the 10 oz bags in the latest lot produced. Rhys selects 24 bags of mini-pretzels at random from the latest lot and counts the number of pretzels in each bag His sample has a mean of 158 pretzels with a standard deviation of 1.6 pretzels. What is the margin of error with 95% confidence (2 = 2.07)? O 0.02 O 66.76 O 0.68 O 6.34arrow_forwardTwelve samples of coal from a Northern Appalachian source had an average mercury content of 0.253 ppm with a standard deviation of 0.029 ppm. Suppose the density of mercury content of coal from this source is approximately normally distributed. a. Find the LOWER bound of a 95% confidence interval for the mean mercury content of coal from this source. b. Find the UPPER bound of a 95% confidence for the mean mercury content of coal from this source.arrow_forwardarrow_back_iosarrow_forward_ios
Recommended textbooks for you
- MATLAB: An Introduction with ApplicationsStatisticsISBN:9781119256830Author:Amos GilatPublisher:John Wiley & Sons Inc
 Probability and Statistics for Engineering and th...StatisticsISBN:9781305251809Author:Jay L. DevorePublisher:Cengage Learning
 Statistics for The Behavioral Sciences (MindTap C...StatisticsISBN:9781305504912Author:Frederick J Gravetter, Larry B. WallnauPublisher:Cengage Learning
  Elementary Statistics: Picturing the World (7th E...StatisticsISBN:9780134683416Author:Ron Larson, Betsy FarberPublisher:PEARSON
 The Basic Practice of StatisticsStatisticsISBN:9781319042578Author:David S. Moore, William I. Notz, Michael A. FlignerPublisher:W. H. Freeman
 Introduction to the Practice of StatisticsStatisticsISBN:9781319013387Author:David S. Moore, George P. McCabe, Bruce A. CraigPublisher:W. H. Freeman
MATLAB: An Introduction with Applications
Statistics
ISBN:9781119256830
Author:Amos Gilat
Publisher:John Wiley & Sons Inc
Probability and Statistics for Engineering and th...
Statistics
ISBN:9781305251809
Author:Jay L. Devore
Publisher:Cengage Learning
Statistics for The Behavioral Sciences (MindTap C...
Statistics
ISBN:9781305504912
Author:Frederick J Gravetter, Larry B. Wallnau
Publisher:Cengage Learning
Elementary Statistics: Picturing the World (7th E...
Statistics
ISBN:9780134683416
Author:Ron Larson, Betsy Farber
Publisher:PEARSON
The Basic Practice of Statistics
Statistics
ISBN:9781319042578
Author:David S. Moore, William I. Notz, Michael A. Fligner
Publisher:W. H. Freeman
Introduction to the Practice of Statistics
Statistics
ISBN:9781319013387
Author:David S. Moore, George P. McCabe, Bruce A. Craig
Publisher:W. H. Freeman