MATLAB: An Introduction with Applications
6th Edition
ISBN: 9781119256830
Author: Amos Gilat
Publisher: John Wiley & Sons Inc
expand_more
expand_more
format_list_bulleted
Concept explainers
Question

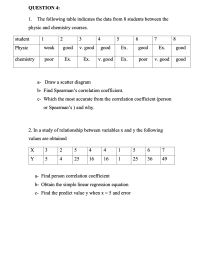
Transcribed Image Text:2. In a study of relationship between variables x and y the following
values are obtained
2
5
4
4
1
7
Y
5
4
25
16
16
1
25
36
49
a- Find person correlation coefficient
b- Obtain the simple linear regression equation
c- Find the predict value y when x = 5 and error
3.
Expert Solution
This question has been solved!
Explore an expertly crafted, step-by-step solution for a thorough understanding of key concepts.
Step by stepSolved in 4 steps with 9 images

Knowledge Booster
Learn more about
Need a deep-dive on the concept behind this application? Look no further. Learn more about this topic, statistics and related others by exploring similar questions and additional content below.Similar questions
- 9. Find the equation of the regression line for the given data. Then construct a scatter plot of the data and draw the regression line. (Each pair of variables has a significant correlation.) Then use the regression equation to predict the value of y for each of the given x-values, if meaningful. The caloric content and the sodium content (in milligrams) for 6 beef hot dogs are shown in the table below. Calories, x Sodium, y 160 130 330 120 70 190 (a) x = 170 calories (c) x = 150 calories 180 (b) x = 80 calories 420 470 360 250 530 (d) x = 210 calories Find the regression equation. x+( (Round to three decimal places as needed.) y = Choose the correct graph below. OA. О В. OC. OD. 560- 560 560 560- 200 G 0IN T> 200 200 Calories Calories Calories Calories (a) Predict the value of y for x = 170. Choose the correct answer below. O A. 411.632 O B. 543.752 O C. 455.672 O D. not meaningful (b) Predict the value of y for x = 80. Choose the correct answer below. O A. 411.632 О В. 257.492 O C.…arrow_forwardd the linear regression equation and the value of the linear correlation coefficient r. Round to 2 decimals. 19) The paired data below consist of the costs of advertising (in thousands of dollars) and the number of products sold (in thousands): Cost| 7 2 3 4 2 5 9 10 Number 85 52 55 68 67 80 83 73 to Cost r =arrow_forward11. The National Oceanic and Atmospheric Administration tracks the amount of oysters harvested from the Chesapeake Bay each year. Years since 1900 10 20 43 52 84 89 Oysters (metric tons) 36 20.6 9.24 8.22 2.73 2.25 a) Is there a correlation? If so, describe the shape and strength. If no correlation, go on to #12, if there is a correlation, complete the parts below. b) The regression equation that describes this: c) Based on this, how much was harvested in 1931? d) What does x = 60 represent? e) Find the value of f(x) when x = 60 What does this mean in context?arrow_forward
- The following table shows students’ number of absences, x, and the student’s final grade,, y.# of absences x 6 2 15 9 12 5 8 Final grade y 82 86 43 74 58 90 78a) Calculate r, the correlation coefficient ________________b) Find the equation of the regression line __________________________________c) If a student is absent 4 times,, what grade does your regression line predict?__________________arrow_forwardA linear regression analysis reveals a strong, negative linear relationship between x and y. Which of the following could possibly be the results from this analysis? (A) ŷ 13.1 27.4x, r = 0.85 (B) == 27.4+ 13.1x, r = -0.95 (D) == (C) ŷ 13.1+ 27.4x, r = 0.95 542 385x, r = -0.15 (E) 0.85 0.25x, r = -0.85arrow_forwardUse the regression equation to predict the value of y for x = -1.6. Assume that the variables x and y have a significant correlation. -5-34 1 -1-2 X 0 2 3 -4 y - -10 8 9 1 -2-6 -1 3 6 -8 OA. 1.214 OB. -2.803 O C. 2.980 OD. -3.907arrow_forward
arrow_back_ios
arrow_forward_ios
Recommended textbooks for you
 MATLAB: An Introduction with ApplicationsStatisticsISBN:9781119256830Author:Amos GilatPublisher:John Wiley & Sons Inc
 Probability and Statistics for Engineering and th...StatisticsISBN:9781305251809Author:Jay L. DevorePublisher:Cengage Learning
 Statistics for The Behavioral Sciences (MindTap C...StatisticsISBN:9781305504912Author:Frederick J Gravetter, Larry B. WallnauPublisher:Cengage Learning
 Elementary Statistics: Picturing the World (7th E...StatisticsISBN:9780134683416Author:Ron Larson, Betsy FarberPublisher:PEARSON
 The Basic Practice of StatisticsStatisticsISBN:9781319042578Author:David S. Moore, William I. Notz, Michael A. FlignerPublisher:W. H. Freeman
 Introduction to the Practice of StatisticsStatisticsISBN:9781319013387Author:David S. Moore, George P. McCabe, Bruce A. CraigPublisher:W. H. Freeman

MATLAB: An Introduction with Applications
Statistics
ISBN:9781119256830
Author:Amos Gilat
Publisher:John Wiley & Sons Inc

Probability and Statistics for Engineering and th...
Statistics
ISBN:9781305251809
Author:Jay L. Devore
Publisher:Cengage Learning

Statistics for The Behavioral Sciences (MindTap C...
Statistics
ISBN:9781305504912
Author:Frederick J Gravetter, Larry B. Wallnau
Publisher:Cengage Learning

Elementary Statistics: Picturing the World (7th E...
Statistics
ISBN:9780134683416
Author:Ron Larson, Betsy Farber
Publisher:PEARSON

The Basic Practice of Statistics
Statistics
ISBN:9781319042578
Author:David S. Moore, William I. Notz, Michael A. Fligner
Publisher:W. H. Freeman

Introduction to the Practice of Statistics
Statistics
ISBN:9781319013387
Author:David S. Moore, George P. McCabe, Bruce A. Craig
Publisher:W. H. Freeman