MATLAB: An Introduction with Applications
6th Edition
ISBN: 9781119256830
Author: Amos Gilat
Publisher: John Wiley & Sons Inc
expand_more
expand_more
format_list_bulleted
Question
thumb_up100%
I have the answers for A-C, Need D-L

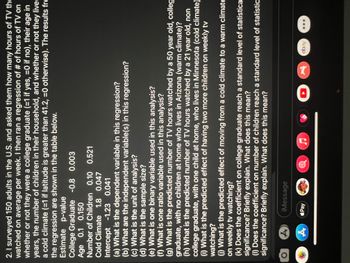
Transcribed Image Text:2. I surveyed 150 adults in the U.S. and asked them how many hours of TV the
watched on average per week. I then ran a regression of # of hours of TV on
whether or not they were a college graduate (=1 if yes, =0 if no), their age in
years, the number of children in their household, and whether or not they live
a cold climate (=1 if latitude is greater than 41.2, =0 otherwise). The results fro
the regression are shown in the table below.
Estimate p-value
College Graduate -0.8 0.003
Age 0.1 0.150
Number of Children 0.10 0.521
Cold Climate 1.8 0.047
Intercept -1.23 0.041
(a) What is the dependent variable in this regression?
(b) What are the independent variable(s) in this regression?
(c) What is the unit of analysis?
(d) What is the sample size?
(e) What is one binary variable used in this analysis?
(f) What is one ratio variable used in this analysis?
(g) What is the predicted number of TV hours watched by a 50 year old, colleg
graduate, with no children at home who lives in Arizona (warm climate)?
(h) What is the predicted number of TV hours watched by a 21 year old, non
college graduate, with one child at home, who lives in Minnesota (cold climate)
(i) What is the predicted effect of having two more children on weekly tv
watching?
(j) What is the predicted effect of moving from a cold climate to a warm climate
on weekly tv watching?
(k) Does the coefficient on college graduate reach a standard level of statistical
significance? Briefly explain. What does this mean?
(1) Does the coefficient on number of children reach a standard level of statistic
significance? Briefly explain. What does this mean?
A
iMessage
#
ebay
A
*Pay
C
1
Expert Solution
This question has been solved!
Explore an expertly crafted, step-by-step solution for a thorough understanding of key concepts.
This is a popular solution
Trending nowThis is a popular solution!
Step by stepSolved in 4 steps

Knowledge Booster
Similar questions
arrow_back_ios
SEE MORE QUESTIONS
arrow_forward_ios
Recommended textbooks for you
 MATLAB: An Introduction with ApplicationsStatisticsISBN:9781119256830Author:Amos GilatPublisher:John Wiley & Sons Inc
 Probability and Statistics for Engineering and th...StatisticsISBN:9781305251809Author:Jay L. DevorePublisher:Cengage Learning
 Statistics for The Behavioral Sciences (MindTap C...StatisticsISBN:9781305504912Author:Frederick J Gravetter, Larry B. WallnauPublisher:Cengage Learning
 Elementary Statistics: Picturing the World (7th E...StatisticsISBN:9780134683416Author:Ron Larson, Betsy FarberPublisher:PEARSON
 The Basic Practice of StatisticsStatisticsISBN:9781319042578Author:David S. Moore, William I. Notz, Michael A. FlignerPublisher:W. H. Freeman
 Introduction to the Practice of StatisticsStatisticsISBN:9781319013387Author:David S. Moore, George P. McCabe, Bruce A. CraigPublisher:W. H. Freeman

MATLAB: An Introduction with Applications
Statistics
ISBN:9781119256830
Author:Amos Gilat
Publisher:John Wiley & Sons Inc

Probability and Statistics for Engineering and th...
Statistics
ISBN:9781305251809
Author:Jay L. Devore
Publisher:Cengage Learning

Statistics for The Behavioral Sciences (MindTap C...
Statistics
ISBN:9781305504912
Author:Frederick J Gravetter, Larry B. Wallnau
Publisher:Cengage Learning

Elementary Statistics: Picturing the World (7th E...
Statistics
ISBN:9780134683416
Author:Ron Larson, Betsy Farber
Publisher:PEARSON

The Basic Practice of Statistics
Statistics
ISBN:9781319042578
Author:David S. Moore, William I. Notz, Michael A. Fligner
Publisher:W. H. Freeman

Introduction to the Practice of Statistics
Statistics
ISBN:9781319013387
Author:David S. Moore, George P. McCabe, Bruce A. Craig
Publisher:W. H. Freeman