Advanced Engineering Mathematics
10th Edition
ISBN: 9780470458365
Author: Erwin Kreyszig
Publisher: Wiley, John & Sons, Incorporated
expand_more
expand_more
format_list_bulleted
Question
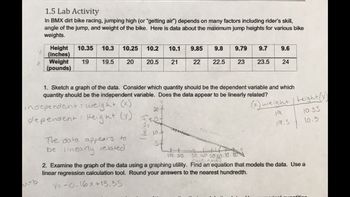
Could you please look at question 2. The instruction say to use a linear regression calculation tool. Isn’t this a graphing calculator?
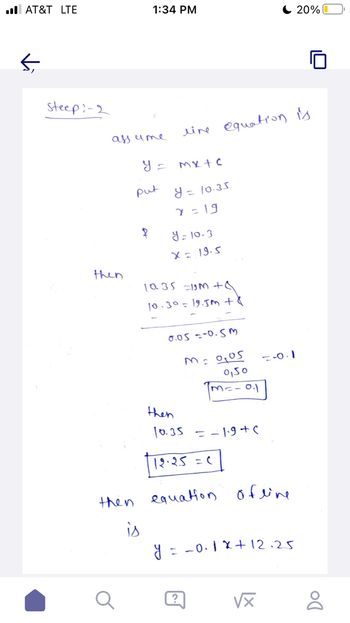
In a prior question, a rep sent a answer where I have no idea where they are getting this answer or why they are solving this problem this way. Could you please review
Thank you,
Ryan

Transcribed Image Text:. AT&T LTE
←
steep: -2
assume
then
then
a
1:34 PM
is
put
y = mx + c
y = 10.35
2=19
8
line equation is
y = 10.3
X=19-5
10.35 =19M + 8
10-30= 19.5m + 8
y
0.05 -0.5m
M = 0,05
0,50
1m² -0.1
then
10.35 -1.9+(
12.25 = c
equation ofline
=-0.1
= -0.1 x + 12.25
√x
20%0
Do

Transcribed Image Text:Y
X
arb
1.5 Lab Activity
In BMX dirt bike racing, jumping high (or "getting air") depends on many factors including rider's skill,
angle of the jump, and weight of the bike. Here is data about the maximum jump heights for various bike
weights.
Height 10.35 10.3
(inches)
19 19.5
Weight
(pounds)
10.25
weight
Height
20
The data appears to
be linearly related
10.2 10.1 9.85
20.5
1. Sketch a graph of the data. Consider which quantity should be the dependent variable and which
quantity should be the independent variable. Does the data appear to be linearly related?
independent:
<+ (x)
dependent:
(y)
21
20+
Erist
2 10+
5
9.8 9.79 9.7 9.6
22 22.5 23 23.5 24
(x) weight / height(y)
19
10.35
19.5
10.3
10 20
30 40 50 60 10
(weight)
2. Examine the graph of the data using a graphing utility. Find an equation that models the data. Use a
linear regression calculation tool. Round your answers to the nearest hundredth.
y=-0.16x +13.35
Expert Solution
This question has been solved!
Explore an expertly crafted, step-by-step solution for a thorough understanding of key concepts.
This is a popular solution
Trending nowThis is a popular solution!
Step by stepSolved in 2 steps

Knowledge Booster
Similar questions
- I am doing a case study for statistics and I have to do a report with it. What do I include on the report? Do I just add bar graphs scatter plots and histograms? can I add multiple regression tables to the report? What should I not include?arrow_forwardPlease help with this problem. Can you please explain using a calculator. Thank you.arrow_forwardPlease help me this question.arrow_forward
- Consider the following passage: I ran a regression, with many variables to predict the result of another variable which was the murder rate. One can see that lots of things, can cause the murder rate to increase or decrease. I tried to account for all the important factors, and those factors are the SAT scores, unemployment rate, and international migration per 1,000. The SAT score is, average combined total score participants did on the SAT exam. The unemployment rate is, "a measure of the prevalence of unemployment and it is calculated as a percentage by dividing the number of unemployed individuals by all individuals currently in the labor force." (Wikipedia) International migration per 1,000 is, the number of people who come into a state from other countries per 1,000 people who live in the state. After I run the regression I will look at the t scores and p values and I should hopefully conclude that international migration does not cause crime. Which writing mistakes, if any, did…arrow_forwardHelp with my homeworkarrow_forwardRange of ankle motion is a contributing factor to falls among the elderly. Suppose a team of researchers is studying how compression hosiery, typical shoes, and medical shoes affect range of ankle motion. In particular, note the variables Barefoot and Footwear2. Barefoot represents a subject's range of ankle motion (in degrees) while barefoot, and Footwear2 represents their range of ankle motion (in degrees) while wearing medical shoes. Use this data and your preferred software to calculate the equation of the least-squares linear regression line to predict a subject's range of ankle motion while wearing medical shoes, ?̂ , based on their range of ankle motion while barefoot, ? . Round your coefficients to two decimal places of precision. ?̂ = A physical therapist determines that her patient Jan has a range of ankle motion of 7.26°7.26° while barefoot. Predict Jan's range of ankle motion while wearing medical shoes, ?̂ . Round your answer to two decimal places. ?̂ = Suppose Jan's…arrow_forward
- What are the coefficients of correlation between miles per gallon and horsepower? Between miles per gallon and the weight of the car? What are the directions and strengths of these coefficients? Do the coefficients of correlation indicate a strong correlation, weak correlation, or no correlation between these variables? See Step 4 in the Python script. Write the multiple regression equation for miles per gallon as the response variable. Use weight and horsepower as predictor variables. See Step 5 in the Python script. How might the car rental company use this model?arrow_forwardIs it reasonable to interpret the y-intercept of the regression line? Why or why not? One home that is 1,750 square feet is listed at $590,000. Is this home's price above or below average for a home of this size? Use residuals and show your work to answer. footaget) ## (Intercept) 21.14411 136.31449 0.155 0.87954 ## footage 0.28388 0.08516 3.333 0.00667 ** ## Residual standard error: 71.64 on 11 degrees of freedom ## Multiple R-squared: 0.5025, Adjusted R-squared: 0.4573 ## F-statistic: 11.11 on 1 and 11 DF, p-value: 0.006671arrow_forwardBelow is the output from regression. Use the p-value and decide if the equation is good to use for forecasting. Group of answer choices A.) p-value = 82 - equation is good to use B.) p-value = 0.15 - equation is not good to use C.) p-value = 0.18 - equation is not good to use D.) p-value = -16 - equation is good to usearrow_forward
- In this section, we introduced a descriptive measure of the utility of the regression equation for making predictions. a. Identify the term and symbol for that descriptive measure. b. Provide an interpretation.arrow_forwardWhat important guideline should you keep in mind when choosing independent variables for multiple regression?arrow_forward
arrow_back_ios
arrow_forward_ios
Recommended textbooks for you
 Advanced Engineering MathematicsAdvanced MathISBN:9780470458365Author:Erwin KreyszigPublisher:Wiley, John & Sons, Incorporated
 Numerical Methods for EngineersAdvanced MathISBN:9780073397924Author:Steven C. Chapra Dr., Raymond P. CanalePublisher:McGraw-Hill Education
 Introductory Mathematics for Engineering Applicat...Advanced MathISBN:9781118141809Author:Nathan KlingbeilPublisher:WILEY
 Mathematics For Machine TechnologyAdvanced MathISBN:9781337798310Author:Peterson, John.Publisher:Cengage Learning,


Advanced Engineering Mathematics
Advanced Math
ISBN:9780470458365
Author:Erwin Kreyszig
Publisher:Wiley, John & Sons, Incorporated

Numerical Methods for Engineers
Advanced Math
ISBN:9780073397924
Author:Steven C. Chapra Dr., Raymond P. Canale
Publisher:McGraw-Hill Education

Introductory Mathematics for Engineering Applicat...
Advanced Math
ISBN:9781118141809
Author:Nathan Klingbeil
Publisher:WILEY

Mathematics For Machine Technology
Advanced Math
ISBN:9781337798310
Author:Peterson, John.
Publisher:Cengage Learning,

