
MATLAB: An Introduction with Applications
6th Edition
ISBN: 9781119256830
Author: Amos Gilat
Publisher: John Wiley & Sons Inc
expand_more
expand_more
format_list_bulleted
Related questions
Question
thumb_up100%
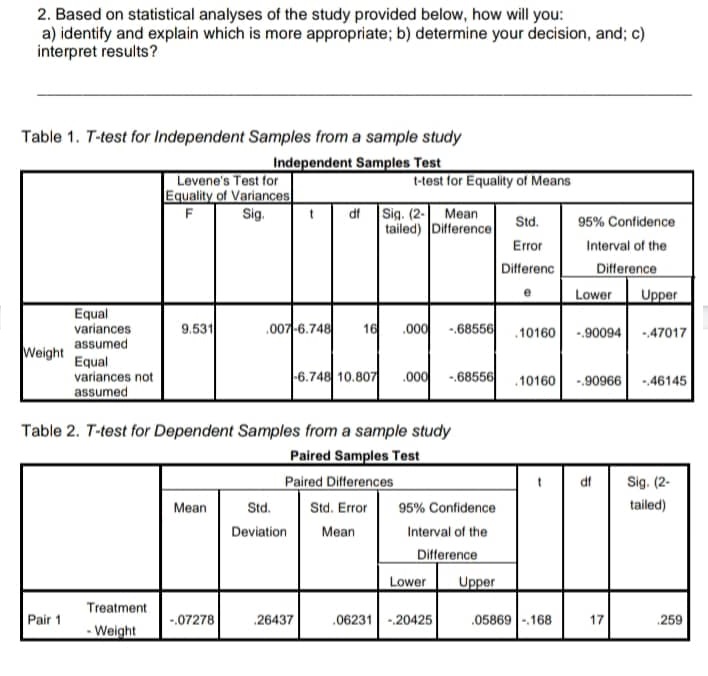

Transcribed Image Text:2. Based on statistical analyses of the study provided below, how will you:
a) identify and explain which is more appropriate; b) determine your decision, and; c)
interpret results?
Table 1. T-test for Independent Samples from a sample study
Independent Samples Test
t-test for Equality of Means
Levene's Test for
Equality of Variances
F Sig.
df Sig. (2- Mean
95% Confidence
tailed) Difference
Std.
Error
Interval of the
Differenc
Difference
e
Lower Upper
Equal
variances
assumed
9.531
007-6.748 16 .000 -68556
.10160 -90094 -47017
Weight
Equal
variances not
-6.748 10.807 .000
-68556
10160
-.90966 -46145
assumed
Table 2. T-test for Dependent Samples from a sample study
Paired Samples Test
Paired Differences
df
Sig. (2-
Mean
Std.
Std. Error
tailed)
Deviation
Mean
Pair 1
Treatment
- Weight
-.07278
26437
95% Confidence
Interval of the
Difference
Lower
06231-20425
Upper
05869-168
17
259
Expert Solution
This question has been solved!
Explore an expertly crafted, step-by-step solution for a thorough understanding of key concepts.

Step by stepSolved in 2 steps

Knowledge Booster

Similar questions
- The data from an independent-measures research study produce a sample mean difference of 4 points and a pooled variance of 16. If there are n = 8 scores in each sample, then what is the estimated standard error for the sample mean difference? Select one: O a. 4 O b. 16 O c. 128 O d. 2arrow_forwardListed in the accompanying table are heights (in.) of mothers and their first daughters. The data pairs are from a journal kept by Francis Galton. Use the listed paired sample data, and assume that the samples are simple random samples and that the differences have a distribution that is approximately normal. Use a 0.05 significance level to test the claim that there is no difference in heights between mothers and their first daughters. ... Question content area top right Part 1 Mother 62.0 65.0 64.7 65.5 65.0 67.0 66.0 66.5 63.0 58.5 Daughter 68.0 69.0 66.5 63.0 68.0 62.0 66.5 66.7 63.5 66.5 Question content area bottom Part 1 In this example, μd is the mean value of the differences d for the population of all pairs of data, where each individual difference d is defined as the daughter's height minus the mother's height. What are the null and alternative hypotheses for the hypothesis test? H0:…arrow_forwardA two-sample hypothesis test is comparing the averages of the following populations. Population 1 is the salary of female employees and Population 2 is the salary of male employees. A hypothesis test was conducted to see if the average salary of males is greater than the average salary of females. Using the following as the output of the test, state the P-value and interpret the results in context to the problem. Use a significance level of 5% Mean Variance Observations Hypothesized Mean Difference df t Stat P(T<=t) one-tail t Critical one-tail P(T<=t) two-tail t Critical two-tail Females Males 65,852.00 89,562.00 1,003.00 1,025.00 45 30 0 37 -1.26 0.1200 1.3300 0.2400 1.2800 For the toolbar, press ALT+F10 (PC) or ALT+FN+F10 (Mac). BIUS Paragraph Arial 10pt EEVA V Tx XQ5 二 三 ||||| WORDS POWERED BY TINYarrow_forward
- Find the range, variance, and standard deviation for the given sample data, if possible. If the measures of variation can be obtained for these values, do the results make sense? Biologists conducted experiments to determine whether a deficiency of carbon dioxide in the soil affects the phenotypes of peas. Listed below are the phenotype codes, where 1 equals smooth-yellow, 2 equals smooth-green, 3 equals wrinkled yellow, and 4 equals wrinkled-green. a. The range of the sample data is (Type an integer or a decimal. Do not round.) b. the standard deviation of the sample data is (Round to one decimal place as needed.) c. The variance of the sample data is (Round to one decimal place as needed.)arrow_forwardFor the accompanying data set, carry out an analysis of variance, including making a table of cell and marginal means and making a bar graph of the cell means. Use the 0.05 significance level. A B Group 1 0 2 5 0 3 0 Group 2 2 0 0 0 0 0arrow_forwardConsider the data below. Three random samples in different cities were selected. Water use per household per day were measured. City 1 City 2 City 3 70 66 66 70 64 66 55 45 54 60 41 61 65 58 65 45 44 65 55 46 Test the claim that the samples come from populations with the same mean. Assume all requirements have been met. Use a 5% level of significance. Identify the tail of the test. [ Select ] Find the P-value. I [ Select ) Will the null hypothesis be rejected? Select] Do the populations appear to have the same mean? [Sclectarrow_forward
- Consider the following data: Step 1 of 3: Calculate the value of the sample variance. Round your answer to one decimal place. Answer How to enter your answer (opens in new window) stical Tables nomial Probabilities nomial Cumulative Poisson Probabilities Poisson Cumulative andard Normal Table t Table - Chi Square F Table - Pearson Correlation Coefficient Nonparametrics - Misc. q Table -2, -2, -8,-8, -2, -8, 12 N ww 3.1 3.0 2.9 2.8 2.7 2.6 2.5 Copy Data Tables Keypad Keyboard Shortcuts 0.07 0.08 0.09 3.3 3.2 Standard Normal Probabilities (z to ∞) 0.00 0.01 0.02 0.03 0.04 0.05 0.06 3.4 0.0003 0.0003 0.0003 0.0003 0.0003 0.0003 0.0003 0.0003 0.0003 0.000 0.0005 0.0005 0.0005 0.0004 0.0004 0.0004 0.0004 0.0004 0.0004 0.000 0.0007 0.0007 0.0006 0.0006 0.0006 0.0006 0.0006 0.0005 0.0005 0.000 0.0010 0.0009 0.0009 0.0009 0.0008 0.0008 0.0008 0.0008 0.0007 0.000 0.0013 0.0013 0.0013 0.0012 0.0012 0.0011 0.0011 0.0011 0.0010 0.001 0.0019 0.0018 0.0018 0.0017 0.0016 0.0016 0.0015 0.0015 0.0014…arrow_forwardThe accompanying table lists pulse rates. Use a 0.05 significance level and apply the methods of two-way analysis of variance. What is the conclusion? Click on the icon to view the data table. C State the null and alternative hypotheses in the test for the effect of an interaction between row and column factors. Ho: There is no interaction between gender and age. H₁: There is an interaction between gender and age. What is the value of the test statistic for this test? F = 3.32 (Round to two decimal places as needed.) What is the corresponding P-value of the test statistic, F, for this P-value= (Round to three decimal places as needed.) Pulse Rates for Gender and Age Over 30 Years of Age Under 30 Years of Age Female 78 103 78 63 61 98 81 98 91 95 77 75 73 65 71 78 61 71 74 55 Female Male 60 81 56 69 68 74 75 68 63 56 46 70 61 65 91 80 59 58 64 59 Male D Xarrow_forwardGiven below are the analysis of variance results from a stat software display comparing sample data for the meanmileage for 4 different types of cars. Assume that you want to use a 0.05 significance level in testing the null hypothesisthat the different samples come from cars with the same mileage. What can you conclude about the equality of the population means?Source DF SS MS F pFactor 3 13.500 4.500 5.17 0.011Error 16 13.925 0.870Total 19 27.425 12)What is the null and alternative hypothesis for this scenari?Based on this One Way Anova software analysis, would you reject of fail to reject the nul hypothesis?What does this result mean in context?arrow_forward
arrow_back_ios
arrow_forward_ios
Recommended textbooks for you
- MATLAB: An Introduction with ApplicationsStatisticsISBN:9781119256830Author:Amos GilatPublisher:John Wiley & Sons Inc
 Probability and Statistics for Engineering and th...StatisticsISBN:9781305251809Author:Jay L. DevorePublisher:Cengage Learning
 Statistics for The Behavioral Sciences (MindTap C...StatisticsISBN:9781305504912Author:Frederick J Gravetter, Larry B. WallnauPublisher:Cengage Learning
  Elementary Statistics: Picturing the World (7th E...StatisticsISBN:9780134683416Author:Ron Larson, Betsy FarberPublisher:PEARSON
 The Basic Practice of StatisticsStatisticsISBN:9781319042578Author:David S. Moore, William I. Notz, Michael A. FlignerPublisher:W. H. Freeman
 Introduction to the Practice of StatisticsStatisticsISBN:9781319013387Author:David S. Moore, George P. McCabe, Bruce A. CraigPublisher:W. H. Freeman
MATLAB: An Introduction with Applications
Statistics
ISBN:9781119256830
Author:Amos Gilat
Publisher:John Wiley & Sons Inc
Probability and Statistics for Engineering and th...
Statistics
ISBN:9781305251809
Author:Jay L. Devore
Publisher:Cengage Learning
Statistics for The Behavioral Sciences (MindTap C...
Statistics
ISBN:9781305504912
Author:Frederick J Gravetter, Larry B. Wallnau
Publisher:Cengage Learning
Elementary Statistics: Picturing the World (7th E...
Statistics
ISBN:9780134683416
Author:Ron Larson, Betsy Farber
Publisher:PEARSON
The Basic Practice of Statistics
Statistics
ISBN:9781319042578
Author:David S. Moore, William I. Notz, Michael A. Fligner
Publisher:W. H. Freeman
Introduction to the Practice of Statistics
Statistics
ISBN:9781319013387
Author:David S. Moore, George P. McCabe, Bruce A. Craig
Publisher:W. H. Freeman