
FINANCIAL ACCOUNTING
10th Edition
ISBN: 9781259964947
Author: Libby
Publisher: MCG
expand_more
expand_more
format_list_bulleted
Related questions
Question
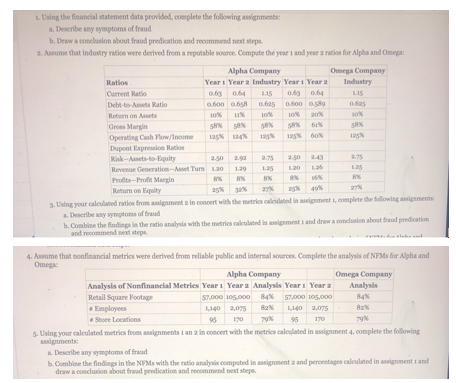

Transcribed Image Text:1. Using the financial statement data provided, complete the following assignments:
a. Deseribe any symptoms of fraud
b. Draw a conclusion about frand predication and recommend next steps.
2. Assume that industry ratios were derived from a reputable source. Compute the year 1 and year a ratios for Alpha and Omega:
Alpha Company
Отеgа Companу
Industry
Ratios
Year i Year a Industry Year i Year a
Current Ratio
0.64
L15
0.63 0.64
LIS
Debt-to-Assets Ratio
0.600 o.658
0.6a5
Return on Assets
10%
10%
20%
s0%
61%
Gross Margin
SRN
Operating Cash Flow/Income
1as
125N
Dupont Expression Ratios
Risk-Aasets-to-Equity
2.50
2.92
2.75
2.50
243
2.75
Revenue Generation-Asset Turn 1.20
1.29
125
L20
Profits-Profit Margin
8%
Return on Equity
as
3. Using your caleulated ratios from asignment a in concert with the metries caleulated in assignment , complete the following aignments
a. Describe any symptoms of fraud
b. Combine the findings in the ratio analysis with the metries caleulated in assignment i and draw a concluion about fraud predication
and recommend next steps.
4. Assume that nonfinancial metrics were derived from reliable public and internal sources. Complete the analysis of NFMS for Alpha and
Omega:
Alpha Company
Отера Company
Analysis of Nonfinancial Metries Year1 Year a Analysis Year i Year a
Analysis
Retal Square Footage
57.000 105.000
84%
57,000 105,000
84%
Employees
1140 2,075
L140 2,075
Store Locations
95
170
79%
95
170
79N
5. Using your caleulated metrics from assignments 1 an 2 in concert with the metrics caleulated in assignment 4, complete the following
assignments:
a Describe any symptoms of fraad
b. Combine the findings in the NFMS with the ratio analysis computed in assignment a and percentages calculated in assignment i and
draw a conclusion about fraad predication and recommend next steps.

Transcribed Image Text:Assume that Alpha and Omega compete in the same four-digit SIC code industry and offer comparable products and services. The following
table contains their reported financial performance and condition for the last two years:
Alpha Company
Omega Company
Balance Sheet
Year 1 Year 2 Analysis Year 1 Year 2
Analysis
Assets-Cash
250
480
92%
250
480
92%
Assets-Accounts Receivable
250
330
32%
250
530
112%
Assets-Long-Term
500
900
80%
500
900
80%
Assets
1,000
1,710
71% 1,000
1,910
91%
Liabilities-Current
400
750
88%
400
750
88%
Liabilities-Long-Term
200
375
88%
88%
200
375
Liabilities
600
1,125
88%
600
1,125
88%
Stockholders' Equity
400
585
46%
400
785
96%
Liabilities and Stockholders' Equity 1,000
1,710
71% 1,000
1,910
91%
Income Statement
Revenues
1,200 2,20o
83% 1,200 2,400
100%
Costs of Goods Sold
500
925
85%
500
925
85%
Gross Profit
700
1,275
82%
700
1,475
111%
600
82%
600
1,090
82%
Operating Expenses
Operating Income
1,090
185
85%
385
285%
100
100
Statement of Cash Flows
85%
385
285%
Operating Income
Depreciation Operating Cash
Operating Cash Flows
100
185
100
25
45
80%
25
-155
-720%
125
230
84%
125
230
84%
Expert Solution
This question has been solved!
Explore an expertly crafted, step-by-step solution for a thorough understanding of key concepts.

This is a popular solution

Trending nowThis is a popular solution!

Step by stepSolved in 2 steps

Knowledge Booster


Learn more about
Need a deep-dive on the concept behind this application? Look no further. Learn more about this topic, accounting and related others by exploring similar questions and additional content below.Similar questions
- Problem 8 (Ratio Calculations) Assume the following relationships for Woody Corp: Sales/Total assets is 1.5x, Return on assets (ROA) is 3.0%, and Return on equity (ROE) is 5.0%. Calculate Woody Corp. profit margin and debt-to-assets ratio assuming the firm uses only debt and common equity.arrow_forwardconsider the following data RF= 4.15% RPM = 5.35% and B= .85 based on the CAPM approach what is the cost of equity from retained earnings?arrow_forwardplease help me thankuarrow_forward
- Qb 08.arrow_forwardTotal debt to total assets% ratio: ?? Round your answer to the nearest hundredth percent Return on equity% ratio: ?? Round your answer to the nearest hundredth percent Asset turnover ratio: ?? Round your answer to the nearest centarrow_forwardWhich company stock is better to invest and whyarrow_forward
- Assume you are given the following relationships for the Haslam Corporation: Sales/total assets 1.7 Return on assets (ROA) 4% Return on equity (ROE) 6% Calculate Haslam's profit margin and liabilities-to-assets ratio. Do not round intermediate calculations. Round your answers to two decimal places. Profit margin: % Liabilities-to-assets ratio: % Suppose half of its liabilities are in the form of debt. Calculate the debt-to-assets ratio. Do not round intermediate calculations. Round your answer to two decimal places. %arrow_forwardKINDLY ANSWER PARTS IV & V FOLLOWED BY PART B.i,ii,iiiarrow_forwardHow to solve questionarrow_forward
- provide reasons for the attached calculated ratios using GSK 2023 annual report and provide non-financail performance analysis examples for GSK 2023.arrow_forwardUsing the financial statements in the image, calculate the following ratios for both the FY 2017 and FY 2018: Current Ratio Quick Ratio Total Asset Turnover Average Collection Total Debt to Total Assets Times Interest Earned Net Profit Margin Return on Assets Return on Equity Modified Du Point Equation for FY 2018 PE Ratio Market to Book Ratioarrow_forwardRatios Calculated Year 1 Year 2 3.64 +Q+ Price-to-cash-flow 5.20 Inventory turnover 10.40 Debt-to-equity 0.70 8.32 0.56 Year 3 2.91 6.66 0.45 Based on the preceding information, your calculations, and your assumptions, which of the following statements can be included in your analysis report? Check all that apply. Cold Goose Metal Works Inc.'s ability to meet its debt obligations has improved since its debt-to-equity ratio decreased from 0.70 to 0.45. A decline in the inventory turnover ratio can be explained by the new Inventory management system that the company recently adopted, which led to more efficient inventory management. A decline in the debt-to-equity ratio implies a decline in the creditworthiness of the firm. A plausible reason why Cold Goose Metal Works Inc.'s price-to-cash-flow ratio has decreased is that investors expect lower cash flow per share in the future.arrow_forward
arrow_back_ios
SEE MORE QUESTIONS
arrow_forward_ios
Recommended textbooks for you
 AccountingAccountingISBN:9781337272094Author:WARREN, Carl S., Reeve, James M., Duchac, Jonathan E.Publisher:Cengage Learning,
 Accounting Information SystemsAccountingISBN:9781337619202Author:Hall, James A.Publisher:Cengage Learning,
 Horngren's Cost Accounting: A Managerial Emphasis...AccountingISBN:9780134475585Author:Srikant M. Datar, Madhav V. RajanPublisher:PEARSON
 Intermediate AccountingAccountingISBN:9781259722660Author:J. David Spiceland, Mark W. Nelson, Wayne M ThomasPublisher:McGraw-Hill Education
 Financial and Managerial AccountingAccountingISBN:9781259726705Author:John J Wild, Ken W. Shaw, Barbara Chiappetta Fundamental Accounting PrinciplesPublisher:McGraw-Hill Education
Accounting
Accounting
ISBN:9781337272094
Author:WARREN, Carl S., Reeve, James M., Duchac, Jonathan E.
Publisher:Cengage Learning,
Accounting Information Systems
Accounting
ISBN:9781337619202
Author:Hall, James A.
Publisher:Cengage Learning,
Horngren's Cost Accounting: A Managerial Emphasis...
Accounting
ISBN:9780134475585
Author:Srikant M. Datar, Madhav V. Rajan
Publisher:PEARSON
Intermediate Accounting
Accounting
ISBN:9781259722660
Author:J. David Spiceland, Mark W. Nelson, Wayne M Thomas
Publisher:McGraw-Hill Education
Financial and Managerial Accounting
Accounting
ISBN:9781259726705
Author:John J Wild, Ken W. Shaw, Barbara Chiappetta Fundamental Accounting Principles
Publisher:McGraw-Hill Education