
MATLAB: An Introduction with Applications
6th Edition
ISBN: 9781119256830
Author: Amos Gilat
Publisher: John Wiley & Sons Inc
expand_more
expand_more
format_list_bulleted
Related questions
Question
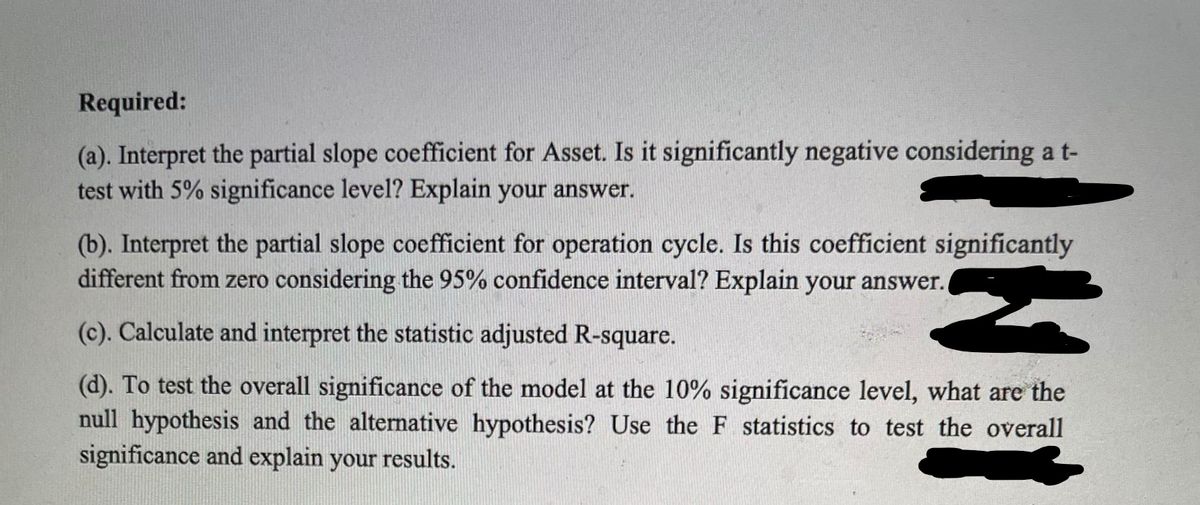

Transcribed Image Text:Required:
(a). Interpret the partial slope coefficient for Asset. Is it significantly negative considering a t-
test with 5% significance level? Explain your answer.
(b). Interpret the partial slope coefficient for operation cycle. Is this coefficient significantly
different from zero considering the 95% confidence interval? Explain your answer.
(c). Calculate and interpret the statistic adjusted R-square.
(d). To test the overall significance of the model at the 10% significance level, what are the
null hypothesis and the alternative hypothesis? Use the F statistics to test the overall
significance and explain your results.

Transcribed Image Text:2. A researcher aims to investigate the determinants of accounting quality of firms. With a
sample that contains 108 firm-year observations from 1984 to 2003, the research run a mult-
variate regression and got the following results:
EQit = Bo + B1ASSET{t + B1STDCF0;t+ B2SALESit + B3CYCLEL
Where EQ is standard deviation of the Earnings; ASSET is total assets; STDCFO is standard
deviation of cash flow from operation; SALES is sales revenue and CYCLE is operating cycle.
Variables
Coefficient
Estimated Standard Deviation
Intercept
0.0157
0.0019
ASSET
-0.0033
-0.0021
STDCFO
0.1388
0.0043
SALES
0.0004
0.0004
CYCLE
0.0321
0.0093
The total sum of squares is 487,135 and the residual sum of squares is 132,576.
Expert Solution
This question has been solved!
Explore an expertly crafted, step-by-step solution for a thorough understanding of key concepts.

Step by stepSolved in 4 steps

Knowledge Booster

Similar questions
- The weights (in pounds) of 6 vehicles and the variability of their braking distances (in feet) when stopping on a dry surface are shown in the table. Can you conclude that there is a significant linear correlation between vehicle weight and variability in braking distance on a dry surface? Use a =0.01. Welght, x Varlablity in braking distance, y 5960 5390 6500 5100 5870 4800 2 1.75 1.95 1.93 1.57 1.64 1.50 E Click here to view a table of critical values for Student's t-distribution. Setup the hypothesis for the test. Ho: P Vo Hạ: p Identify the critical value(s). Select the correct choice below and fill in any answer boxes within your choice. (Round to three decimal places as needed.) O A. The critical values are -to = and to = O B. The critical value is. Calculate the test statistic. t= (Round to three decimal places as needed.) What is your conclusion? a significant linear correlation between vehicle weight and variability in braking distance on a dry surface. There Venough evidence…arrow_forwardListed below are altitudes (thousands of feet) and outside air temperatures (°F) recorded during a flight. Find the (a) explained variation, (b) unexplained variation, and (c) indicated prediction interval. There is sufficient evidence to support a claim of a linear correlation, so it is reasonable to use the regression equation when making predictions. For the prediction interval, use a 95% confidence level with the altitude of 6327 ft (or 6.327 thousand feet). Altitude Temperature a. Find the explained variation. (Round to two decimal places as needed.) 2 55 8 40 13 25 20 - 3 28 - 26 31 - 41 34 - 53arrow_forwardThe Cadet is a popular model of sport utility vehicle, known for its relatively high resale value. The bivariate data given below were taken from a sample of fifteen Cadets, each bought new two years ago, and each sold used within the past month. For each Cadet in the sample, we have listed both the mileage x (in thousands of miles) that the Cadet had on its odometer at the time it was sold used and the price y (in thousands of dollars) at which the Cadet was sold used. The least-squares regression line for these data has equation y = 40.86-0.45x. This line is shown in the scatter plot below. Mileage, x (in thousands) 29.7 27.8 26.8 24.2 21.1 23.0 24.3 15.4 37.7 23.6 34.4 27.8 23.5 20.9 259 Used selling price, y (in thousands of dollars) 27.4 29.4 31.2 30.1 31.7 31.7 27.2 34.2 23.4 28.2 26.3 26.5 33.7 30.6 267 Used selling price (in thousands of dollars) 40- 35+ 30- 25- 20 THIS 15 X 20 X X X 30 Mileagex (in thousands) X 35 40arrow_forward
- Qualitative researchers should view the opinions of other researchers about the themes derived from data analysis as biased. This is because other researchers would not be as familiar with the results as the researcher. True False A researcher has conducted a crosstabs analysis to understand the distribution of income across 3 different gender groups (male, female and non-binary). They notes that the Chi-square test produced an asymptotic significance level of 0.027. What does this suggest? (pick the most appropriate interpretation) Income does not vary across different genders Income does not differ across the different grouops There are significant differences in the distribution of income for the male, female and non-binary groups The male group has sufficiently more income compared to the female and non-binary groupsarrow_forwardResearchers at UC San Francisco discovered that highplasma levels of vitamins B, C, D, and E are associated with better cognitive performance. “Each standard devia-tion higher plasma level for these vitamins predicted a global cognitive score 0.28 standard deviations better,”the researchers reported. Which value are the researchersinterpreting in this statement?A) the correlation coefficient between plasma level andcognitive scoreB) the y-intercept of the regression model predictingcognitive score from plasma levelC) the slope of the regression model predicting cognitivescore from plasma levelD) the standard deviation of the regression model’sresidualsE) R2for the regression modelarrow_forwardA researcher developed a regression model to predict the tear rating of a bag of coffee based on the plate gap in bag-sealing equipment. Data were collected on 28 bags in which the plate gap was varied. An analysis of variance from the regression showed that b, = 0.7909 and Sp. = 0.2294. a. At the 0.05 level of significance, is there evidence of a linear relationship between the plate gap of the bag-sealing machine and the tear rating of a bag of coffee? b. Construct a 95% confidence interval estimate of the population slope, B1. .....arrow_forward
- The full question for the last question is written down below Fail/fail to reject H0. There is insufficient/sufficient evidence at the 10% level of significance to support the claim that there is a linear relationship between weight and number of hours slept.arrow_forwardThe Cadet is a popular model of sport utility vehicle, known for its relatively high resale value. The bivariate data given below were taken from a sample of sixteen Cadets, each bought new two years ago, and each sold used within the past month. For each Cadet in the sample, we have listed both the mileage x (in thousands of miles) that the Cadet had on its odometer at the time it was sold used and the price y (in thousands of dollars) at which the Cadet was sold used. The least-squares regression line for these data has equation Ŷ=42.80-0.53x. This line is shown in the scatter plot below. (The 2nd picture contains the rest of the data as it would not fit in the first pic and it includes the question as well.)arrow_forwardLet's study the relationship between brand, camera resolution, and internal storage capacity on the price of smartphones. Use α = .05 to perform a regression analysis of the Smartphones01CS dataset, and then answer the following questions. When you copy and paste output from MegaStat to answer a question, remember to choose to "Keep Formatting" to paste the text. a. Did you find any evidence of multicollinearity and variance inflation among the predictors. Explain your answer using a VIF analysis. b. Copy and paste the normal probability plot for your analysis. Is there any evidence that the errors are not normally distributed? Explain. c. Copy and paste the Residuals vs. Predicted Y-values. Does the pattern support the null hypothesis of constant variance for the errors? Explain. d. Study the residuals analysis. Which observations, if any, have unusual residuals? e. Study the residuals analysis. Calculate the leverage statistic. Which observations, if any, are high leverage…arrow_forward
arrow_back_ios
arrow_forward_ios
Recommended textbooks for you
- MATLAB: An Introduction with ApplicationsStatisticsISBN:9781119256830Author:Amos GilatPublisher:John Wiley & Sons Inc
 Probability and Statistics for Engineering and th...StatisticsISBN:9781305251809Author:Jay L. DevorePublisher:Cengage Learning
 Statistics for The Behavioral Sciences (MindTap C...StatisticsISBN:9781305504912Author:Frederick J Gravetter, Larry B. WallnauPublisher:Cengage Learning
  Elementary Statistics: Picturing the World (7th E...StatisticsISBN:9780134683416Author:Ron Larson, Betsy FarberPublisher:PEARSON
 The Basic Practice of StatisticsStatisticsISBN:9781319042578Author:David S. Moore, William I. Notz, Michael A. FlignerPublisher:W. H. Freeman
 Introduction to the Practice of StatisticsStatisticsISBN:9781319013387Author:David S. Moore, George P. McCabe, Bruce A. CraigPublisher:W. H. Freeman
MATLAB: An Introduction with Applications
Statistics
ISBN:9781119256830
Author:Amos Gilat
Publisher:John Wiley & Sons Inc
Probability and Statistics for Engineering and th...
Statistics
ISBN:9781305251809
Author:Jay L. Devore
Publisher:Cengage Learning
Statistics for The Behavioral Sciences (MindTap C...
Statistics
ISBN:9781305504912
Author:Frederick J Gravetter, Larry B. Wallnau
Publisher:Cengage Learning
Elementary Statistics: Picturing the World (7th E...
Statistics
ISBN:9780134683416
Author:Ron Larson, Betsy Farber
Publisher:PEARSON
The Basic Practice of Statistics
Statistics
ISBN:9781319042578
Author:David S. Moore, William I. Notz, Michael A. Fligner
Publisher:W. H. Freeman
Introduction to the Practice of Statistics
Statistics
ISBN:9781319013387
Author:David S. Moore, George P. McCabe, Bruce A. Craig
Publisher:W. H. Freeman