MATLAB: An Introduction with Applications
6th Edition
ISBN: 9781119256830
Author: Amos Gilat
Publisher: John Wiley & Sons Inc
expand_more
expand_more
format_list_bulleted
Question
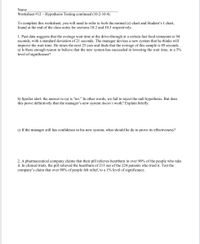
can you please answer number 2 thank you

Transcribed Image Text:Name
Worksheet #12 – Hypothesis Testing continued (10.2-10.4)
To complete this worksheet, you will need to refer to both the normal (z) chart and Student's t chart,
found at the end of the class notes for sections 10.2 and 10.3 respectively.
1. Past data suggests that the average wait time at the drive-through at a certain fast food restaurant is 94
seconds, with a standard deviation of 21 seconds. The manager devises a new system that he thinks will
improve the wait time. He times the next 25 cars and finds that the average of this sample is 89 seconds.
a) Is there enough reason to believe that the new system has succeeded in lowering the wait time, to a 5%
level of significance?
b) Spoiler alert: the answer to (a) is “no." In other words, we fail to reject the null hypothesis. But does
this prove definitively that the manager's new system doesn't work? Explain briefly.
c) If the manager still has confidence in his new system, what should he do to prove its effectiveness?
2. A pharmaceutical company claims that their pill relieves heartburn in over 90% of the people who take
it. In clinical trials, the pill relieved the heartburn of 213 out of the 224 patients who tried it. Test the
company's claim that over 90% of people felt relief, to a 1% level of significance.
Expert Solution
This question has been solved!
Explore an expertly crafted, step-by-step solution for a thorough understanding of key concepts.
Step by stepSolved in 2 steps with 1 images

Knowledge Booster
Similar questions
Recommended textbooks for you
 MATLAB: An Introduction with ApplicationsStatisticsISBN:9781119256830Author:Amos GilatPublisher:John Wiley & Sons Inc
 Probability and Statistics for Engineering and th...StatisticsISBN:9781305251809Author:Jay L. DevorePublisher:Cengage Learning
 Statistics for The Behavioral Sciences (MindTap C...StatisticsISBN:9781305504912Author:Frederick J Gravetter, Larry B. WallnauPublisher:Cengage Learning
 Elementary Statistics: Picturing the World (7th E...StatisticsISBN:9780134683416Author:Ron Larson, Betsy FarberPublisher:PEARSON
 The Basic Practice of StatisticsStatisticsISBN:9781319042578Author:David S. Moore, William I. Notz, Michael A. FlignerPublisher:W. H. Freeman
 Introduction to the Practice of StatisticsStatisticsISBN:9781319013387Author:David S. Moore, George P. McCabe, Bruce A. CraigPublisher:W. H. Freeman

MATLAB: An Introduction with Applications
Statistics
ISBN:9781119256830
Author:Amos Gilat
Publisher:John Wiley & Sons Inc

Probability and Statistics for Engineering and th...
Statistics
ISBN:9781305251809
Author:Jay L. Devore
Publisher:Cengage Learning

Statistics for The Behavioral Sciences (MindTap C...
Statistics
ISBN:9781305504912
Author:Frederick J Gravetter, Larry B. Wallnau
Publisher:Cengage Learning

Elementary Statistics: Picturing the World (7th E...
Statistics
ISBN:9780134683416
Author:Ron Larson, Betsy Farber
Publisher:PEARSON

The Basic Practice of Statistics
Statistics
ISBN:9781319042578
Author:David S. Moore, William I. Notz, Michael A. Fligner
Publisher:W. H. Freeman

Introduction to the Practice of Statistics
Statistics
ISBN:9781319013387
Author:David S. Moore, George P. McCabe, Bruce A. Craig
Publisher:W. H. Freeman