
MATLAB: An Introduction with Applications
6th Edition
ISBN: 9781119256830
Author: Amos Gilat
Publisher: John Wiley & Sons Inc
expand_more
expand_more
format_list_bulleted
Related questions
Question
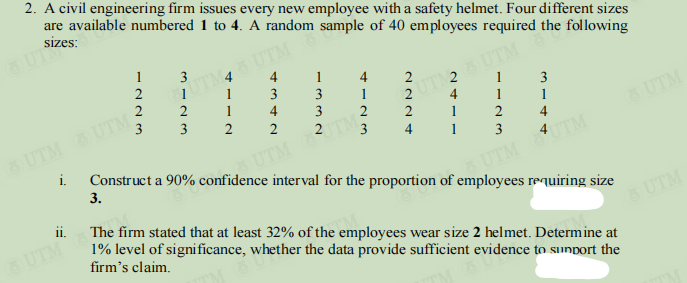

Transcribed Image Text:2. A civil engineering firm issues every new employee with a safety helmet. Four different sizes
are available numbered 1 to 4. A random sample of 40 employees required the following
sizes:
QUI Size
1
3
4
2
UTM UTM 6
1
1
4
1
2
3
13
3
2
2
1
UTD28 UTM
1
4
4
3
1
1
2
3
UTM
3
2
2
2
1
2
4
3
4
UTM UTM
1
3
i.
UTM 82
Construct a 90% confidence interval for the proportion of employees requiring size
3.
UTM UTM
11.
The firm stated that at least 32% of the employees wear size 2 helmet. Determine at
1% level of significance, whether the data provide sufficient evidence to support the
firm's claim.
2
Expert Solution
This question has been solved!
Explore an expertly crafted, step-by-step solution for a thorough understanding of key concepts.

This is a popular solution

Trending nowThis is a popular solution!

Step by stepSolved in 3 steps with 16 images

Knowledge Booster

Similar questions
- Three randomly selected children are surveyed. The ages of the children are 3, 5, and 10. Assume that samples of size n= 2 are randomly selected with replacement from the population of 3, 5, and 10. Listed below are the nine different samples. Complete parts (a) through (d). 3,3 3,5 3,10 5,3 5,5 5,10 10,3 10,5 10,10 . a. For the population, find the proportion of odd numbers. The proportion is (Round to three decimal places as needed) b. Find the proportion of odd numbers of each of the nine samples, then summarize the sampling distribution of the medians in the format of a table representing the probability distribution of the distinct proportion values ce! Sample Proportion Probability Tool (Type integers or simplified fractions.) c. Find the mean of the sampling distribution of the sample proportion of odd numbers. The mean is (Round to three decimal places as needed ) Next Activanearrow_forwardThree randomly selected households are surveyed. The numbers of people in the households are 4, 5, and 9. Assume that samples of size n= 2 are randomly selected with replacement from the population of 4, 5, and 9. Listed below are the nine diff Print samples. Complete parts (a) through (c). 4,4 4,5 4,9 5,4 5,5 5,9 9,4 9,5 9,9 D a. Find the median of each of the nine samples, then summarize the sampling distribution of the medians in the format of a table representing the probability distribution of the distinct median values. Sample Median (1) Probability (2) (3) (4) (5) (6) (Type integers or fractions. Use ascending order of the sample medians.) b. Compare the population median to the mean of the sample medians. Choose the correct answer below. O A. The population median is equal to half of the mean of the sample medians. O B. The population median is not equal to the mean of the sample medians (it is also not half or double the mean of the sample medians).arrow_forward1arrow_forward
- Q1-5: Given the following data from a sample of sizen= 7 12 7 49073 The third qoartile is: Select one: O a. 4 O b. 7 O c. 8 O d. 9arrow_forwardand o from the given parameters of the population and sample size. Determine u = 84, o = 18, n = 81 .....arrow_forwardThree randomly selected households are surveyed. The numbers of people in the households are 4, 5, and 9. Assume that samples of sizen=2 are randomly selected with replacement from the population of 4, 5, and 9. Listed below are the nine diff Prin samples. Complete parts (a) through (c). 4,4 4,5 4,9 5,4 5,5 5,9 9,4 9,5 9,9 O a. Find the median of each of the nine samples, then summarize the sampling distribution of the medians in the format of a table representing the probability distribution of the distinct median values. Sample Median (1) Probability (2) (3) (4) (5) (6) (Type integers or fractions. Use ascending order of the sample medians.) b. Compare the population median to the mean of the sample medians. Choose the correct answer below. O A. The population median is equal to half of the mean of the sample medians. O B. The population median is not equal to the mean of the sample medians (it is also not half or double the mean of the sample medians). OC. The population median is…arrow_forward
arrow_back_ios
arrow_forward_ios
Recommended textbooks for you
- MATLAB: An Introduction with ApplicationsStatisticsISBN:9781119256830Author:Amos GilatPublisher:John Wiley & Sons Inc
 Probability and Statistics for Engineering and th...StatisticsISBN:9781305251809Author:Jay L. DevorePublisher:Cengage Learning
 Statistics for The Behavioral Sciences (MindTap C...StatisticsISBN:9781305504912Author:Frederick J Gravetter, Larry B. WallnauPublisher:Cengage Learning
  Elementary Statistics: Picturing the World (7th E...StatisticsISBN:9780134683416Author:Ron Larson, Betsy FarberPublisher:PEARSON
 The Basic Practice of StatisticsStatisticsISBN:9781319042578Author:David S. Moore, William I. Notz, Michael A. FlignerPublisher:W. H. Freeman
 Introduction to the Practice of StatisticsStatisticsISBN:9781319013387Author:David S. Moore, George P. McCabe, Bruce A. CraigPublisher:W. H. Freeman
MATLAB: An Introduction with Applications
Statistics
ISBN:9781119256830
Author:Amos Gilat
Publisher:John Wiley & Sons Inc
Probability and Statistics for Engineering and th...
Statistics
ISBN:9781305251809
Author:Jay L. Devore
Publisher:Cengage Learning
Statistics for The Behavioral Sciences (MindTap C...
Statistics
ISBN:9781305504912
Author:Frederick J Gravetter, Larry B. Wallnau
Publisher:Cengage Learning
Elementary Statistics: Picturing the World (7th E...
Statistics
ISBN:9780134683416
Author:Ron Larson, Betsy Farber
Publisher:PEARSON
The Basic Practice of Statistics
Statistics
ISBN:9781319042578
Author:David S. Moore, William I. Notz, Michael A. Fligner
Publisher:W. H. Freeman
Introduction to the Practice of Statistics
Statistics
ISBN:9781319013387
Author:David S. Moore, George P. McCabe, Bruce A. Craig
Publisher:W. H. Freeman