
MATLAB: An Introduction with Applications
6th Edition
ISBN: 9781119256830
Author: Amos Gilat
Publisher: John Wiley & Sons Inc
expand_more
expand_more
format_list_bulleted
Related questions
Question
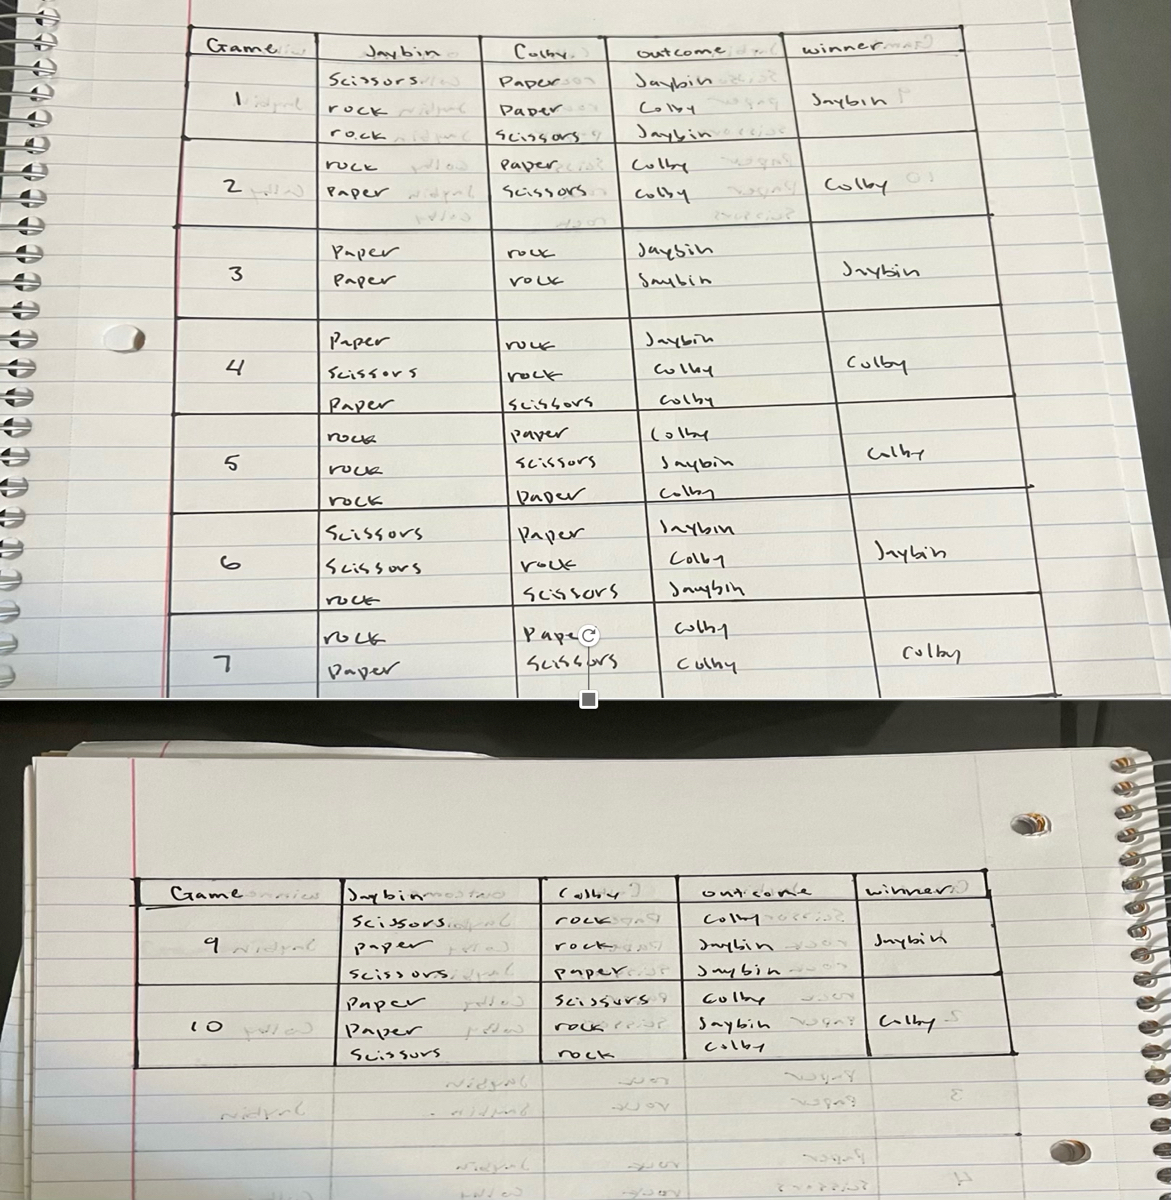
The data is in the the pictures that I added

Transcribed Image Text:DIT
Game.
3
4
5
6
10
ruck
2 Paper widprl scissors.
7
Стате ovies
9 Nidyal
Jaybin
Scissors/
Nidruć
rock circ
rock
Paper
Paper
Paper
Scissors
Paper
поск
roce
rock
Scissors
Scissors
roce
поск
Paper
Colby
Paperson
Paper
Paper
Scissors
Paper
Scissors
Paper Colby
Colby
rock
Jaybinmos two
Scissors.
paper
Scissors,
Volk
rou
rock
scissors
paver
scissors
Paper
Paper
rock
Scissors
Pape@
Scissors
الله لو ما را
ک سوال کے کام
ب الله )
rock
rock
outcome..
Jaybin
Colby
Jaybin ise
rock
Jaysin
Saybin
2
Jaybin
Colby
Colby
Colby
Jaybin
colby
paperP
Scissurs
rockist
Jaybin
Colby
Jaybin
Jang Colby
Murcia
colby
Culhy
57
winnerAt
Jaybin
out cone
Colby
Jaybin
Jaybin
Jaybin
Colby
colby
،۰۰۰ ...
Jaybin
colby
winner
Jaybin
Colby
Jaybin gn: Colby S
colby

Transcribed Image Text:●
(2) Make a frequency table to show the frequency with which you chose each response.
(3) From your frequency table, calculate the proportion of your responses that were Rock, the
proportion that were Paper, and the proportion that were Scissors.
(4) Make a two-way table to show the relationship between your response and the outcome of
each round.
(5) From your two-way table, calculate the proportion of Rock responses that resulted in a win,
the proportion of Paper responses that resulted in a win, and the proportion of Scissors
responses that resulted in a win.
(6) From your two-way table, calculate the proportion of wins that resulted from a Rock re-
sponse, the proportion of wins that resulted from a Paper response, and the proportion of wins
that resulted from a Scissors response. (NOTE: This is a different question from (5)
(7) From your data, which response seems most likely to result in a win?
(8) Can you conclude from (6) which response is most likely to result in a win in general, for all
Rock-Paper-Scissors players? Why or why not? How might you design an experiment to
determine which response is most likely to result in a win in general?
Expert Solution
This question has been solved!
Explore an expertly crafted, step-by-step solution for a thorough understanding of key concepts.

Step by stepSolved in 5 steps

Knowledge Booster

Similar questions
- summarize skew, parallel and perpendicular lines.arrow_forwardMatch these values of r with the accompanying scatterplots: 1, 0.997, - 0.405, 0.405, and - 0.761. W Click the icon to view the scatterplots. i Scatterplots Match the values of r to the scatterplots. Scatterplot 1, r= Scatterplot 2, r= plot 1 Scatterplot 2 Scatterplot 3 Scatterplot 3, r= Q 8- 8- Scatterplot 4, r= 6- 6- Scatterplot 5, r= > 4- 4- 2- 2- 0+ 0.2 0.4 0.6 0.8 0- 0.2 0.4 0.6 0.8 6 0.8 plot 4 Scatterplot 5 8- 6- 4- 2- .6 0.8 0- 0.2 0.4 0.6 0.8 Print Donearrow_forwardThe city of Oakland wishes to see if there is a relationship between the temperature and the amount of electricity used (in kilowatts)arrow_forward
- 1. Graph y = x and label it "Line A". 2. Graph y = -x+3 and label it "Line B". 3. Graph y=-3 and label it "Line C". %3Darrow_forwardThe blue line is a called a line. The red line is called a line.arrow_forwardWrite the equation corresponding to the graph of y = 5* after having been translated three units upward, four units to the left, and las reflected over the x-axis. Write your answer without using parentheses. Enter your next step herearrow_forward
arrow_back_ios
SEE MORE QUESTIONS
arrow_forward_ios
Recommended textbooks for you
- MATLAB: An Introduction with ApplicationsStatisticsISBN:9781119256830Author:Amos GilatPublisher:John Wiley & Sons Inc
 Probability and Statistics for Engineering and th...StatisticsISBN:9781305251809Author:Jay L. DevorePublisher:Cengage Learning
 Statistics for The Behavioral Sciences (MindTap C...StatisticsISBN:9781305504912Author:Frederick J Gravetter, Larry B. WallnauPublisher:Cengage Learning
  Elementary Statistics: Picturing the World (7th E...StatisticsISBN:9780134683416Author:Ron Larson, Betsy FarberPublisher:PEARSON
 The Basic Practice of StatisticsStatisticsISBN:9781319042578Author:David S. Moore, William I. Notz, Michael A. FlignerPublisher:W. H. Freeman
 Introduction to the Practice of StatisticsStatisticsISBN:9781319013387Author:David S. Moore, George P. McCabe, Bruce A. CraigPublisher:W. H. Freeman
MATLAB: An Introduction with Applications
Statistics
ISBN:9781119256830
Author:Amos Gilat
Publisher:John Wiley & Sons Inc
Probability and Statistics for Engineering and th...
Statistics
ISBN:9781305251809
Author:Jay L. Devore
Publisher:Cengage Learning
Statistics for The Behavioral Sciences (MindTap C...
Statistics
ISBN:9781305504912
Author:Frederick J Gravetter, Larry B. Wallnau
Publisher:Cengage Learning
Elementary Statistics: Picturing the World (7th E...
Statistics
ISBN:9780134683416
Author:Ron Larson, Betsy Farber
Publisher:PEARSON
The Basic Practice of Statistics
Statistics
ISBN:9781319042578
Author:David S. Moore, William I. Notz, Michael A. Fligner
Publisher:W. H. Freeman
Introduction to the Practice of Statistics
Statistics
ISBN:9781319013387
Author:David S. Moore, George P. McCabe, Bruce A. Craig
Publisher:W. H. Freeman