
MATLAB: An Introduction with Applications
6th Edition
ISBN: 9781119256830
Author: Amos Gilat
Publisher: John Wiley & Sons Inc
expand_more
expand_more
format_list_bulleted
Related questions
Question
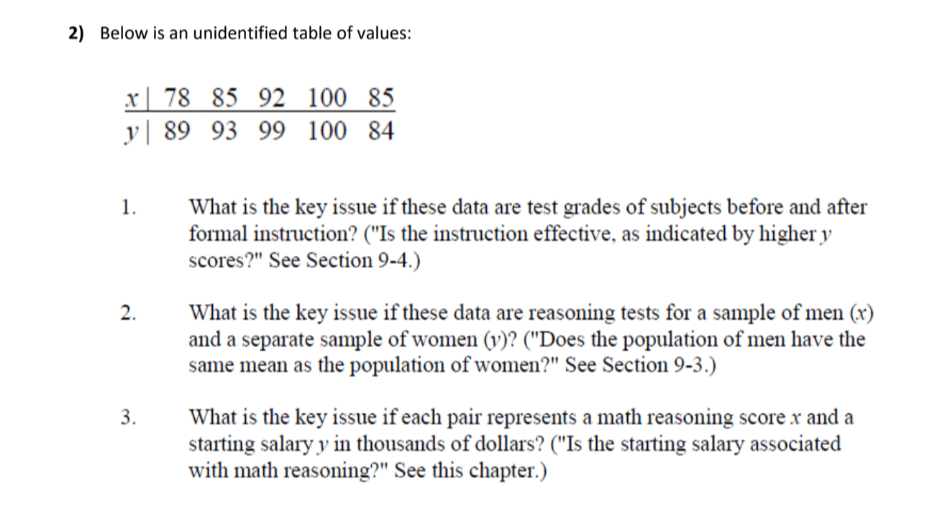

Transcribed Image Text:2) Below is an unidentified table of values:
x
78 85 92 100 85
89 93 99 100 84
y
1.
What is the key issue if these data are test grades of subjects before and after
formal instruction? ("Is the instruction effective, as indicated by higher y
scores?" See Section 9-4.)
2.
What is the key issue if these data are reasoning tests for a sample of men (x)
and a separate sample of women (y)? ("Does the population of men have the
same mean as the population of women?" See Section 9-3.)
What is the key issue if each pair represents a math reasoning score x and a
starting salary y in thousands of dollars? ("Is the starting salary associated
with math reasoning?" See this chapter.)
3.
Expert Solution
This question has been solved!
Explore an expertly crafted, step-by-step solution for a thorough understanding of key concepts.

Step by stepSolved in 4 steps

Knowledge Booster

Similar questions
- A researcher conducts a study comparing anxiety levels in teens based on their social media usage. Teens with higher scores on the anxiety measure are considered more anxious. Below is a table made from their results. Briefly interpret the results by explaining both descriptive and inferential statistics identified.arrow_forwardPls solve both questions with details explanation and no plagiarism , for good ratingarrow_forwardThe boxplot shown below results from the heights (cm) of males listed in a data set. What do the numbers in that boxplot tell us? 154 173.8 194 169.7 183.5 The minimum height is cm, the first quartile Q, is cm, the second quartile Q, (or the median) is cm, the third quartile Q, is cm, and the maximum height is cm. (Type integers or decimals. Do not round,)arrow_forward
- Help!!arrow_forward(c) Draw a boxplot of the differenced data. Does this visual evidence support the results obtained in part (b)? Which boxplot below represents the data? A. O C. -6 -6 -4 -2 Differences -2 Differences 2 Q 2대 B. -6 -6 -4 -4 -2 Differences Differences 0 0 2arrow_forwardWe discuss how to test for an association between two categorical variables in Section 6.8. A marine research team records the number of fish from 3 species that they find at different depth categories in the ocean. They are interested in assessing whether or not there is a relationship between the depth category (close to surface, mid-level, ocean floor) and the fish species found (species A, species B, species C). A two-way table showing the classification of a sample of 150 observations is given below. If the variables for the ocean depth category and the species are independent, how would you calculate the expected number of fish that are at the mid-level and from species C? Expected number =arrow_forward
arrow_back_ios
arrow_forward_ios
Recommended textbooks for you
- MATLAB: An Introduction with ApplicationsStatisticsISBN:9781119256830Author:Amos GilatPublisher:John Wiley & Sons Inc
 Probability and Statistics for Engineering and th...StatisticsISBN:9781305251809Author:Jay L. DevorePublisher:Cengage Learning
 Statistics for The Behavioral Sciences (MindTap C...StatisticsISBN:9781305504912Author:Frederick J Gravetter, Larry B. WallnauPublisher:Cengage Learning
  Elementary Statistics: Picturing the World (7th E...StatisticsISBN:9780134683416Author:Ron Larson, Betsy FarberPublisher:PEARSON
 The Basic Practice of StatisticsStatisticsISBN:9781319042578Author:David S. Moore, William I. Notz, Michael A. FlignerPublisher:W. H. Freeman
 Introduction to the Practice of StatisticsStatisticsISBN:9781319013387Author:David S. Moore, George P. McCabe, Bruce A. CraigPublisher:W. H. Freeman
MATLAB: An Introduction with Applications
Statistics
ISBN:9781119256830
Author:Amos Gilat
Publisher:John Wiley & Sons Inc
Probability and Statistics for Engineering and th...
Statistics
ISBN:9781305251809
Author:Jay L. Devore
Publisher:Cengage Learning
Statistics for The Behavioral Sciences (MindTap C...
Statistics
ISBN:9781305504912
Author:Frederick J Gravetter, Larry B. Wallnau
Publisher:Cengage Learning
Elementary Statistics: Picturing the World (7th E...
Statistics
ISBN:9780134683416
Author:Ron Larson, Betsy Farber
Publisher:PEARSON
The Basic Practice of Statistics
Statistics
ISBN:9781319042578
Author:David S. Moore, William I. Notz, Michael A. Fligner
Publisher:W. H. Freeman
Introduction to the Practice of Statistics
Statistics
ISBN:9781319013387
Author:David S. Moore, George P. McCabe, Bruce A. Craig
Publisher:W. H. Freeman