
MATLAB: An Introduction with Applications
6th Edition
ISBN: 9781119256830
Author: Amos Gilat
Publisher: John Wiley & Sons Inc
expand_more
expand_more
format_list_bulleted
Related questions
Concept explainers
Question
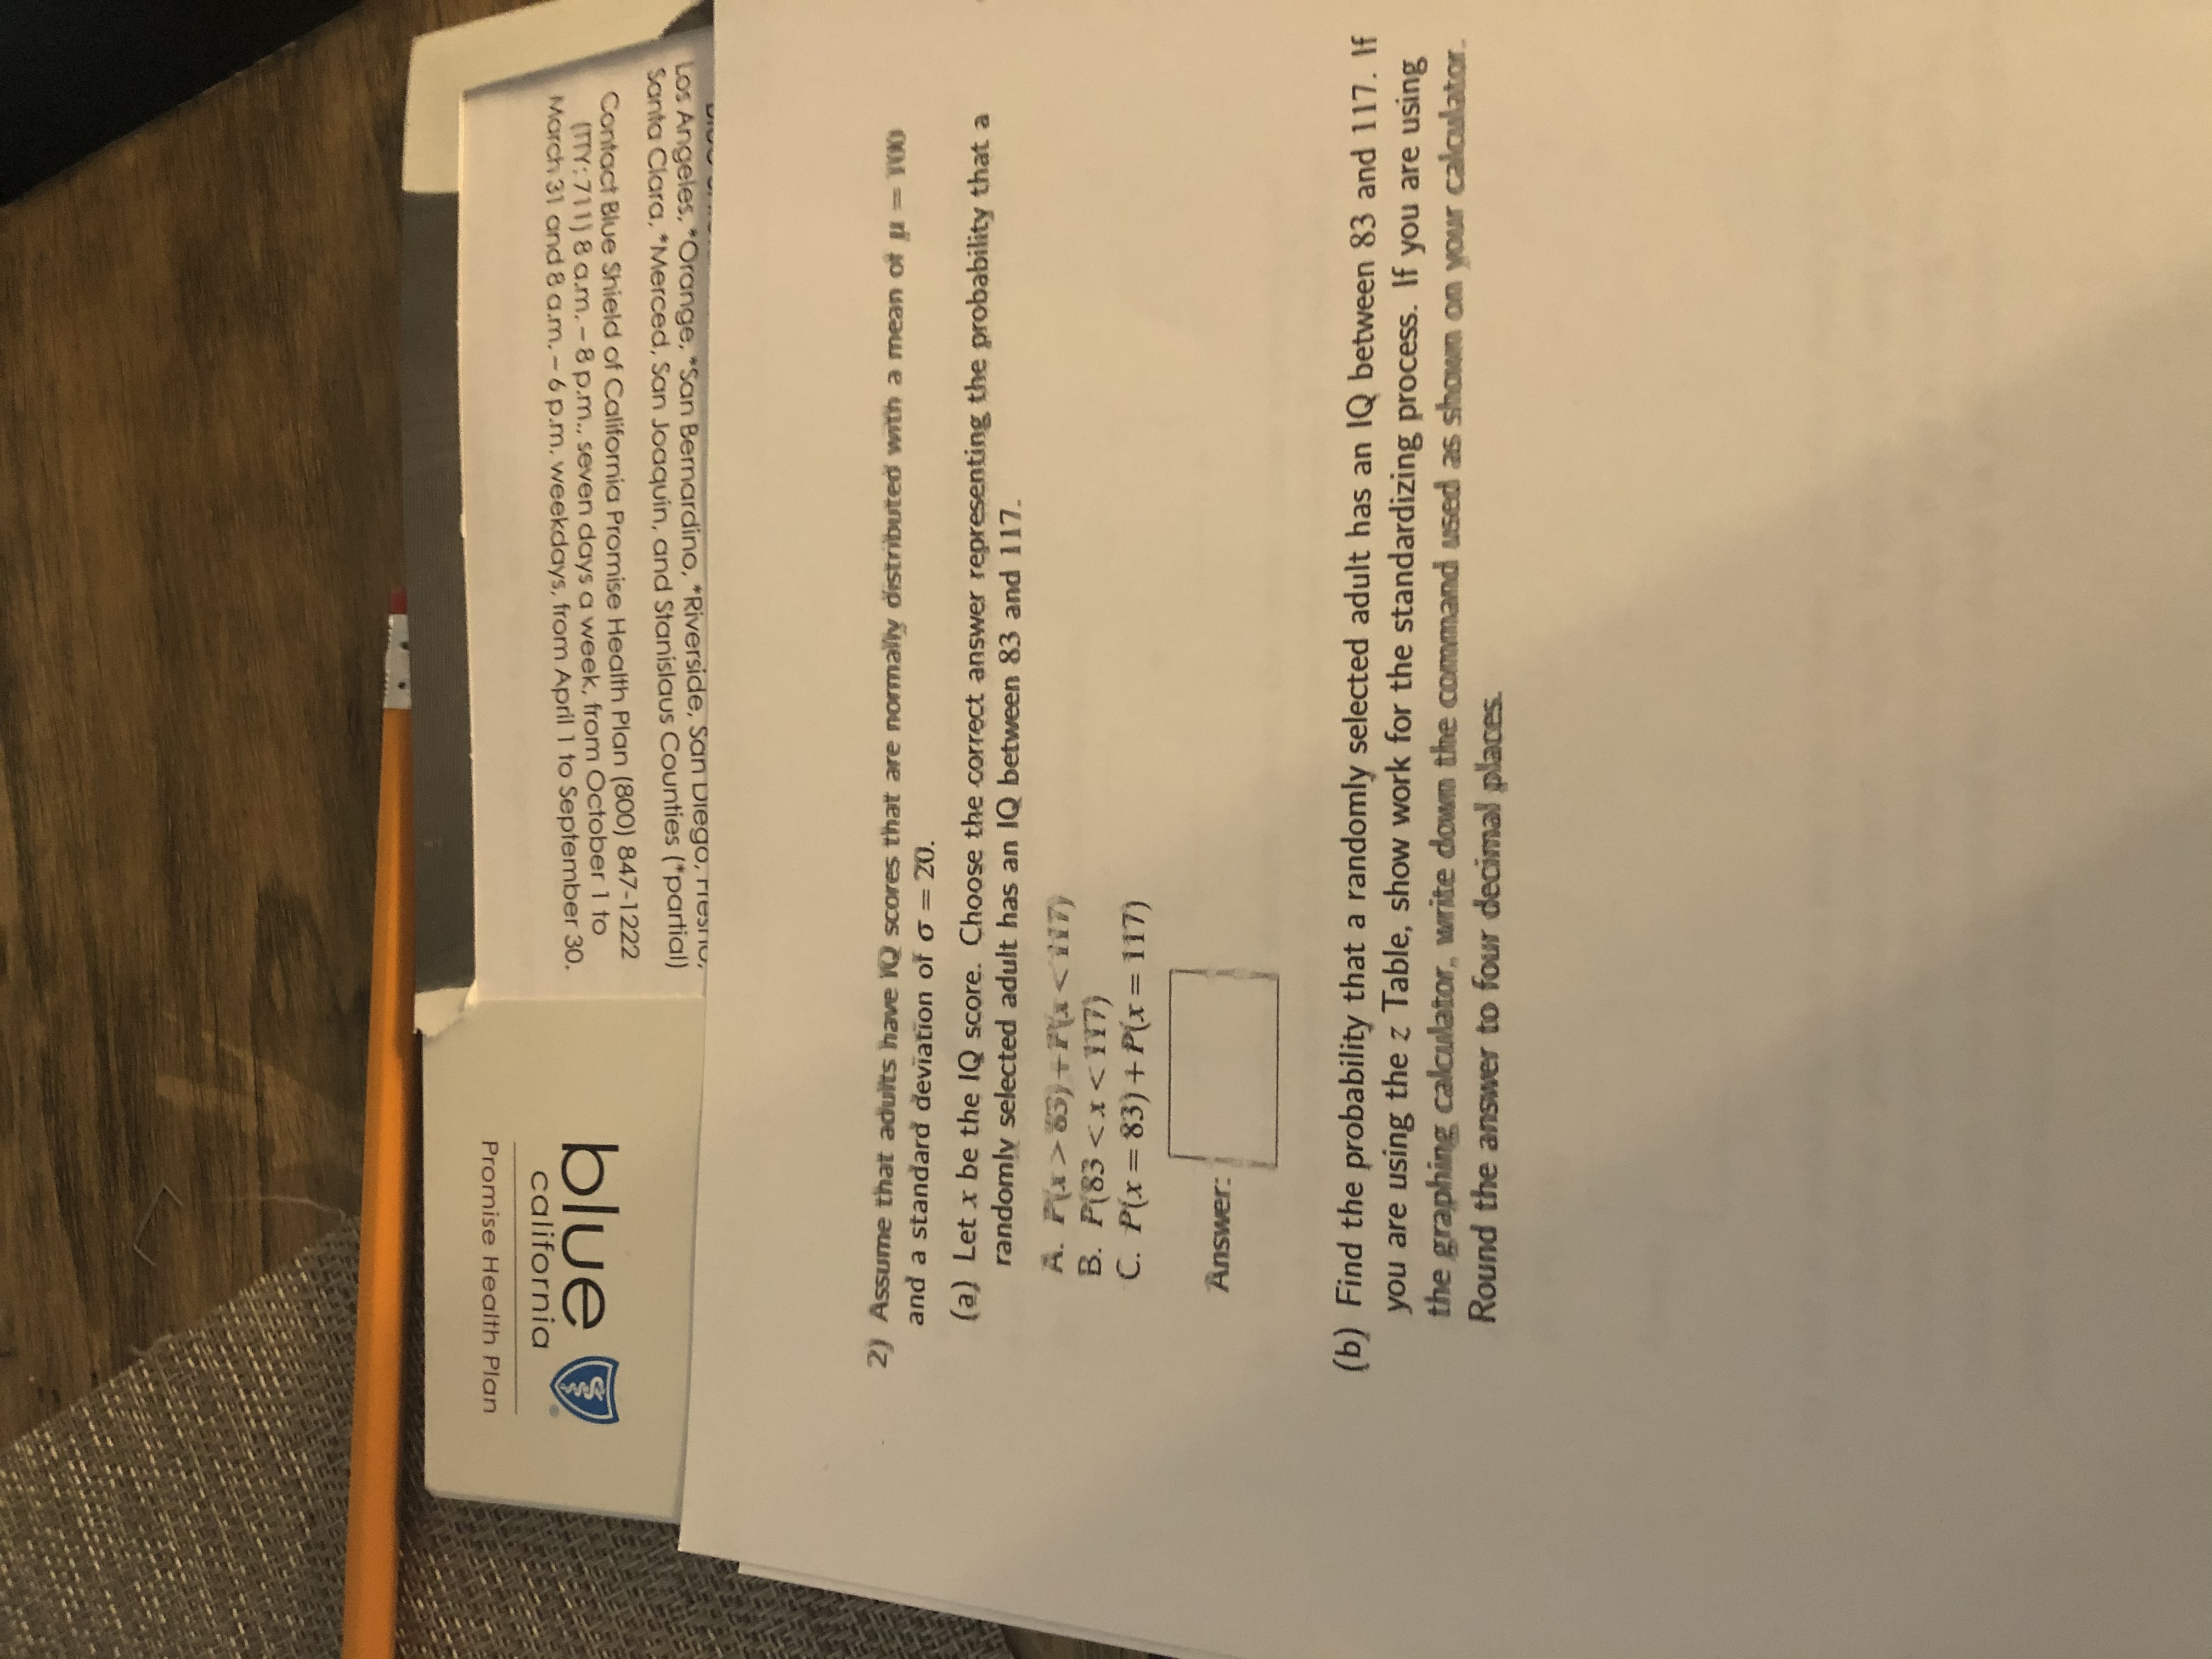

Transcribed Image Text:2) Assume that aduits have 1Q scores that are normaly distributed with a mean of u = T00
and a standard đeviation of o =20.
(a) Let x be the IQ score. Choose the correct answer representing the probability that a
randomly selected adult has an IQ between 83 and 117.
A. P{x>83)+7{x<ii7}
B. P(83 <x< 17)
C. P(x=83)+P(x = 117)
%3D
Answer:
(b) Find the probability that a randomly selected adult has an IQ between 83 and 117.
you are using the z Table, show work for the standardizing process. If you are using
the graphing calculator, write down the command used as shown on your calculato
Round the answer to four decimal places.
Expert Solution
This question has been solved!
Explore an expertly crafted, step-by-step solution for a thorough understanding of key concepts.

This is a popular solution

Trending nowThis is a popular solution!

Step by stepSolved in 2 steps with 1 images

Knowledge Booster


Learn more about
Need a deep-dive on the concept behind this application? Look no further. Learn more about this topic, statistics and related others by exploring similar questions and additional content below.Similar questions
- Assume that the random variable X is normally distributed with mean = 186.8 and standard deviation = 32. Let n = 50. Find P(195< < 200).arrow_forwardwhere appropriate. 1. Experience has shown that the seeds from a certain variety of orchid have a 75% chance of germinating when planted under normal conditions. Suppose n seeds are planted, and let X be the random variable that counts the number of seeds that germinate. (a) What type of random variable is X? Indicate both the type and the appropriate parameters using the "~" notation. Write down the pmf of X, and do not forget to indicate the range of values that x can take on. X ~ px (x) = = (b) What is the minimum value of n so that the probability of at least five of the seeds germinating is at least 90%?arrow_forwardLet XX represent the full height of a certain species of tree. Assume that XX has a normal probability distribution with a mean of 97.9 ft and a standard deviation of 5.4 ft.A tree of this type grows in my backyard, and it stands 86 feet tall. Find the probability that the height of a randomly selected tree is as tall as mine or shorter.P(X<86)P(X<86) = My neighbor also has a tree of this type growing in her backyard, but hers stands 112.5 feet tall. Find the probability that the full height of a randomly selected tree is at least as tall as hers.P(X>112.5)P(X>112.5) = Enter your answers as decimals accurate to 4 decimal places.arrow_forward
- Let XX represent the full height of a certain species of tree. Assume that XX has a normal probability distribution with a mean of 320 ft and a standard deviation of 45 ft.Find the probability that the height of a randomly selected tree is between 334 ft and 388 ft. P(334 < X < 388) = Enter your answer as a number accurate to 3 decimal places.arrow_forwardLet X denote the data transfer time (ms) in a grid computing system (the time required for data transfer between a "worker" computer and a "master" computer. Suppose that X has a gamma distribution with mean value 37.5 ms and standard deviation 21.3. Round all answers to 4 decimal places and 3 = b) What is the probability that data transfer time exceeds 49 ms? a) What are the values of a = ? c) What is the probability that the data transfer time is between 49 and 67 ms?arrow_forwardA sample of n = 20 observations is drawn from a normal population with u = 1100 and o = 180. Find each of the following: A. P(X > 1176) Probability = B. P(X 1063) Probability =arrow_forward
arrow_back_ios
arrow_forward_ios
Recommended textbooks for you
- MATLAB: An Introduction with ApplicationsStatisticsISBN:9781119256830Author:Amos GilatPublisher:John Wiley & Sons Inc
 Probability and Statistics for Engineering and th...StatisticsISBN:9781305251809Author:Jay L. DevorePublisher:Cengage Learning
 Statistics for The Behavioral Sciences (MindTap C...StatisticsISBN:9781305504912Author:Frederick J Gravetter, Larry B. WallnauPublisher:Cengage Learning
  Elementary Statistics: Picturing the World (7th E...StatisticsISBN:9780134683416Author:Ron Larson, Betsy FarberPublisher:PEARSON
 The Basic Practice of StatisticsStatisticsISBN:9781319042578Author:David S. Moore, William I. Notz, Michael A. FlignerPublisher:W. H. Freeman
 Introduction to the Practice of StatisticsStatisticsISBN:9781319013387Author:David S. Moore, George P. McCabe, Bruce A. CraigPublisher:W. H. Freeman
MATLAB: An Introduction with Applications
Statistics
ISBN:9781119256830
Author:Amos Gilat
Publisher:John Wiley & Sons Inc
Probability and Statistics for Engineering and th...
Statistics
ISBN:9781305251809
Author:Jay L. Devore
Publisher:Cengage Learning
Statistics for The Behavioral Sciences (MindTap C...
Statistics
ISBN:9781305504912
Author:Frederick J Gravetter, Larry B. Wallnau
Publisher:Cengage Learning
Elementary Statistics: Picturing the World (7th E...
Statistics
ISBN:9780134683416
Author:Ron Larson, Betsy Farber
Publisher:PEARSON
The Basic Practice of Statistics
Statistics
ISBN:9781319042578
Author:David S. Moore, William I. Notz, Michael A. Fligner
Publisher:W. H. Freeman
Introduction to the Practice of Statistics
Statistics
ISBN:9781319013387
Author:David S. Moore, George P. McCabe, Bruce A. Craig
Publisher:W. H. Freeman