
MATLAB: An Introduction with Applications
6th Edition
ISBN: 9781119256830
Author: Amos Gilat
Publisher: John Wiley & Sons Inc
expand_more
expand_more
format_list_bulleted
Related questions
Concept explainers
Question

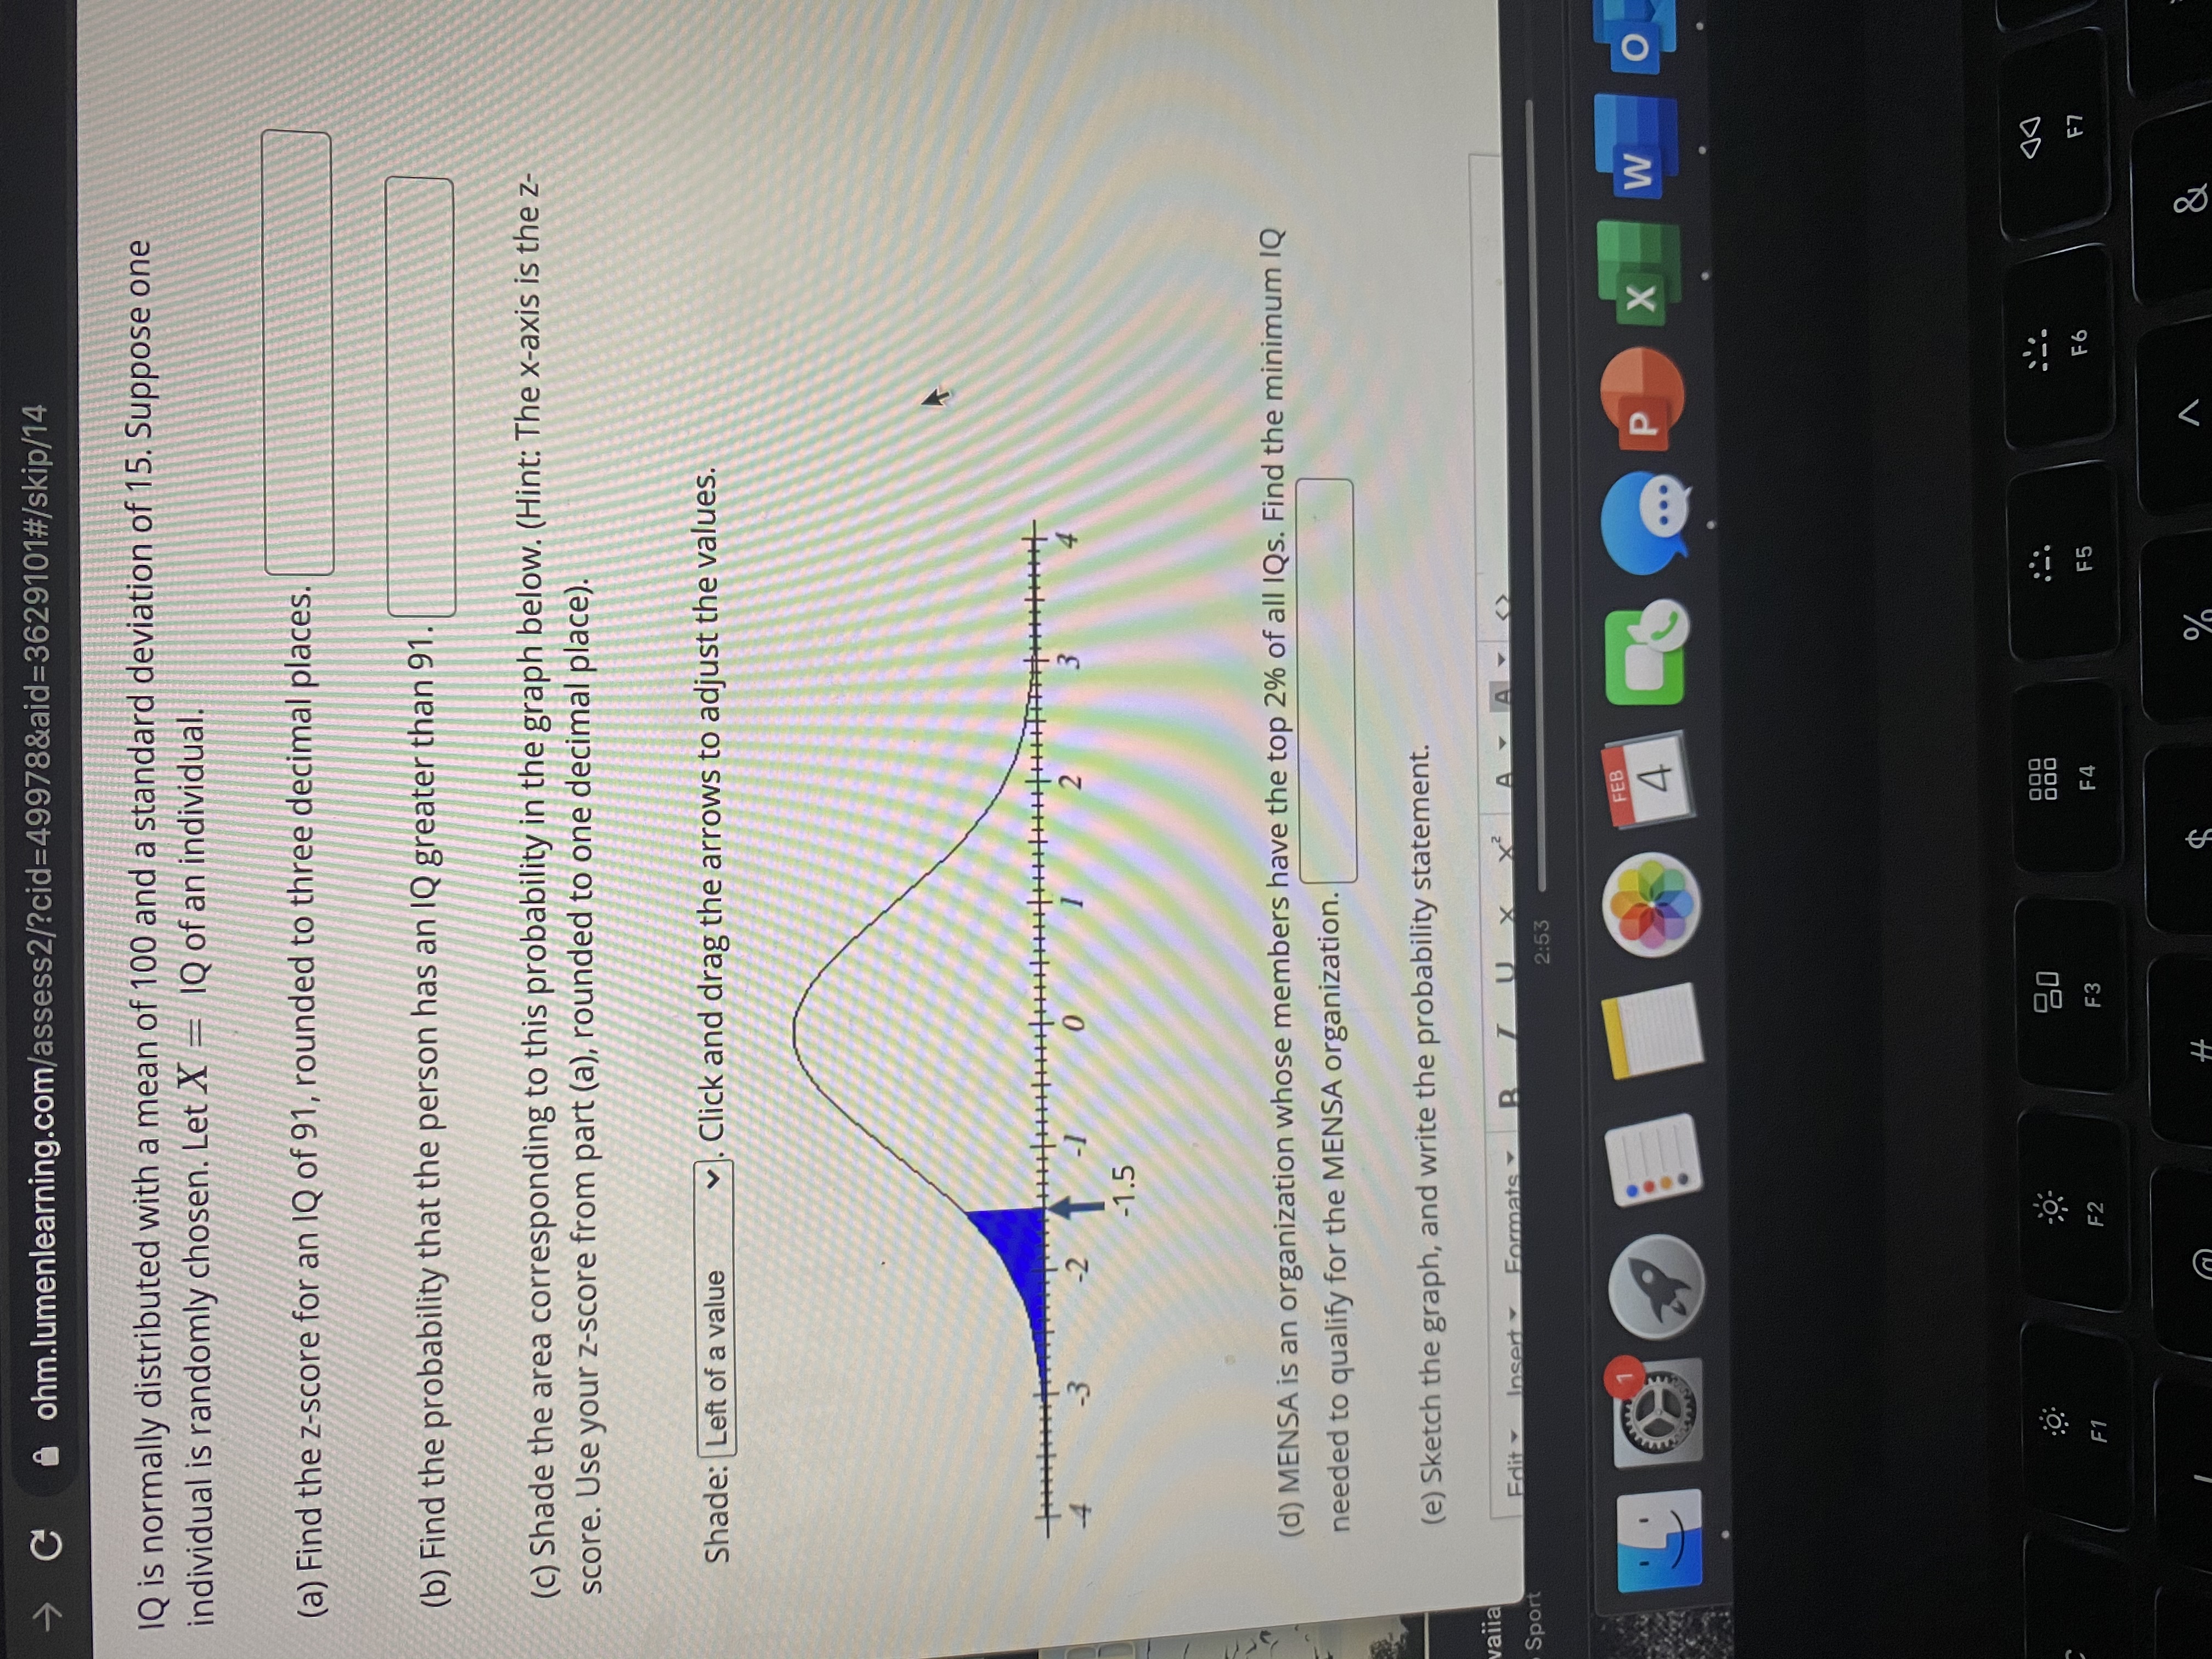
Transcribed Image Text:1Q is normally distributed with a mean of 100 and a standard deviation of 15. Suppose one
individual is randomly chosen. Let X = \Q of an individual.
(a) Find the z-score for an IQ of 91, rounded to three decimal places.
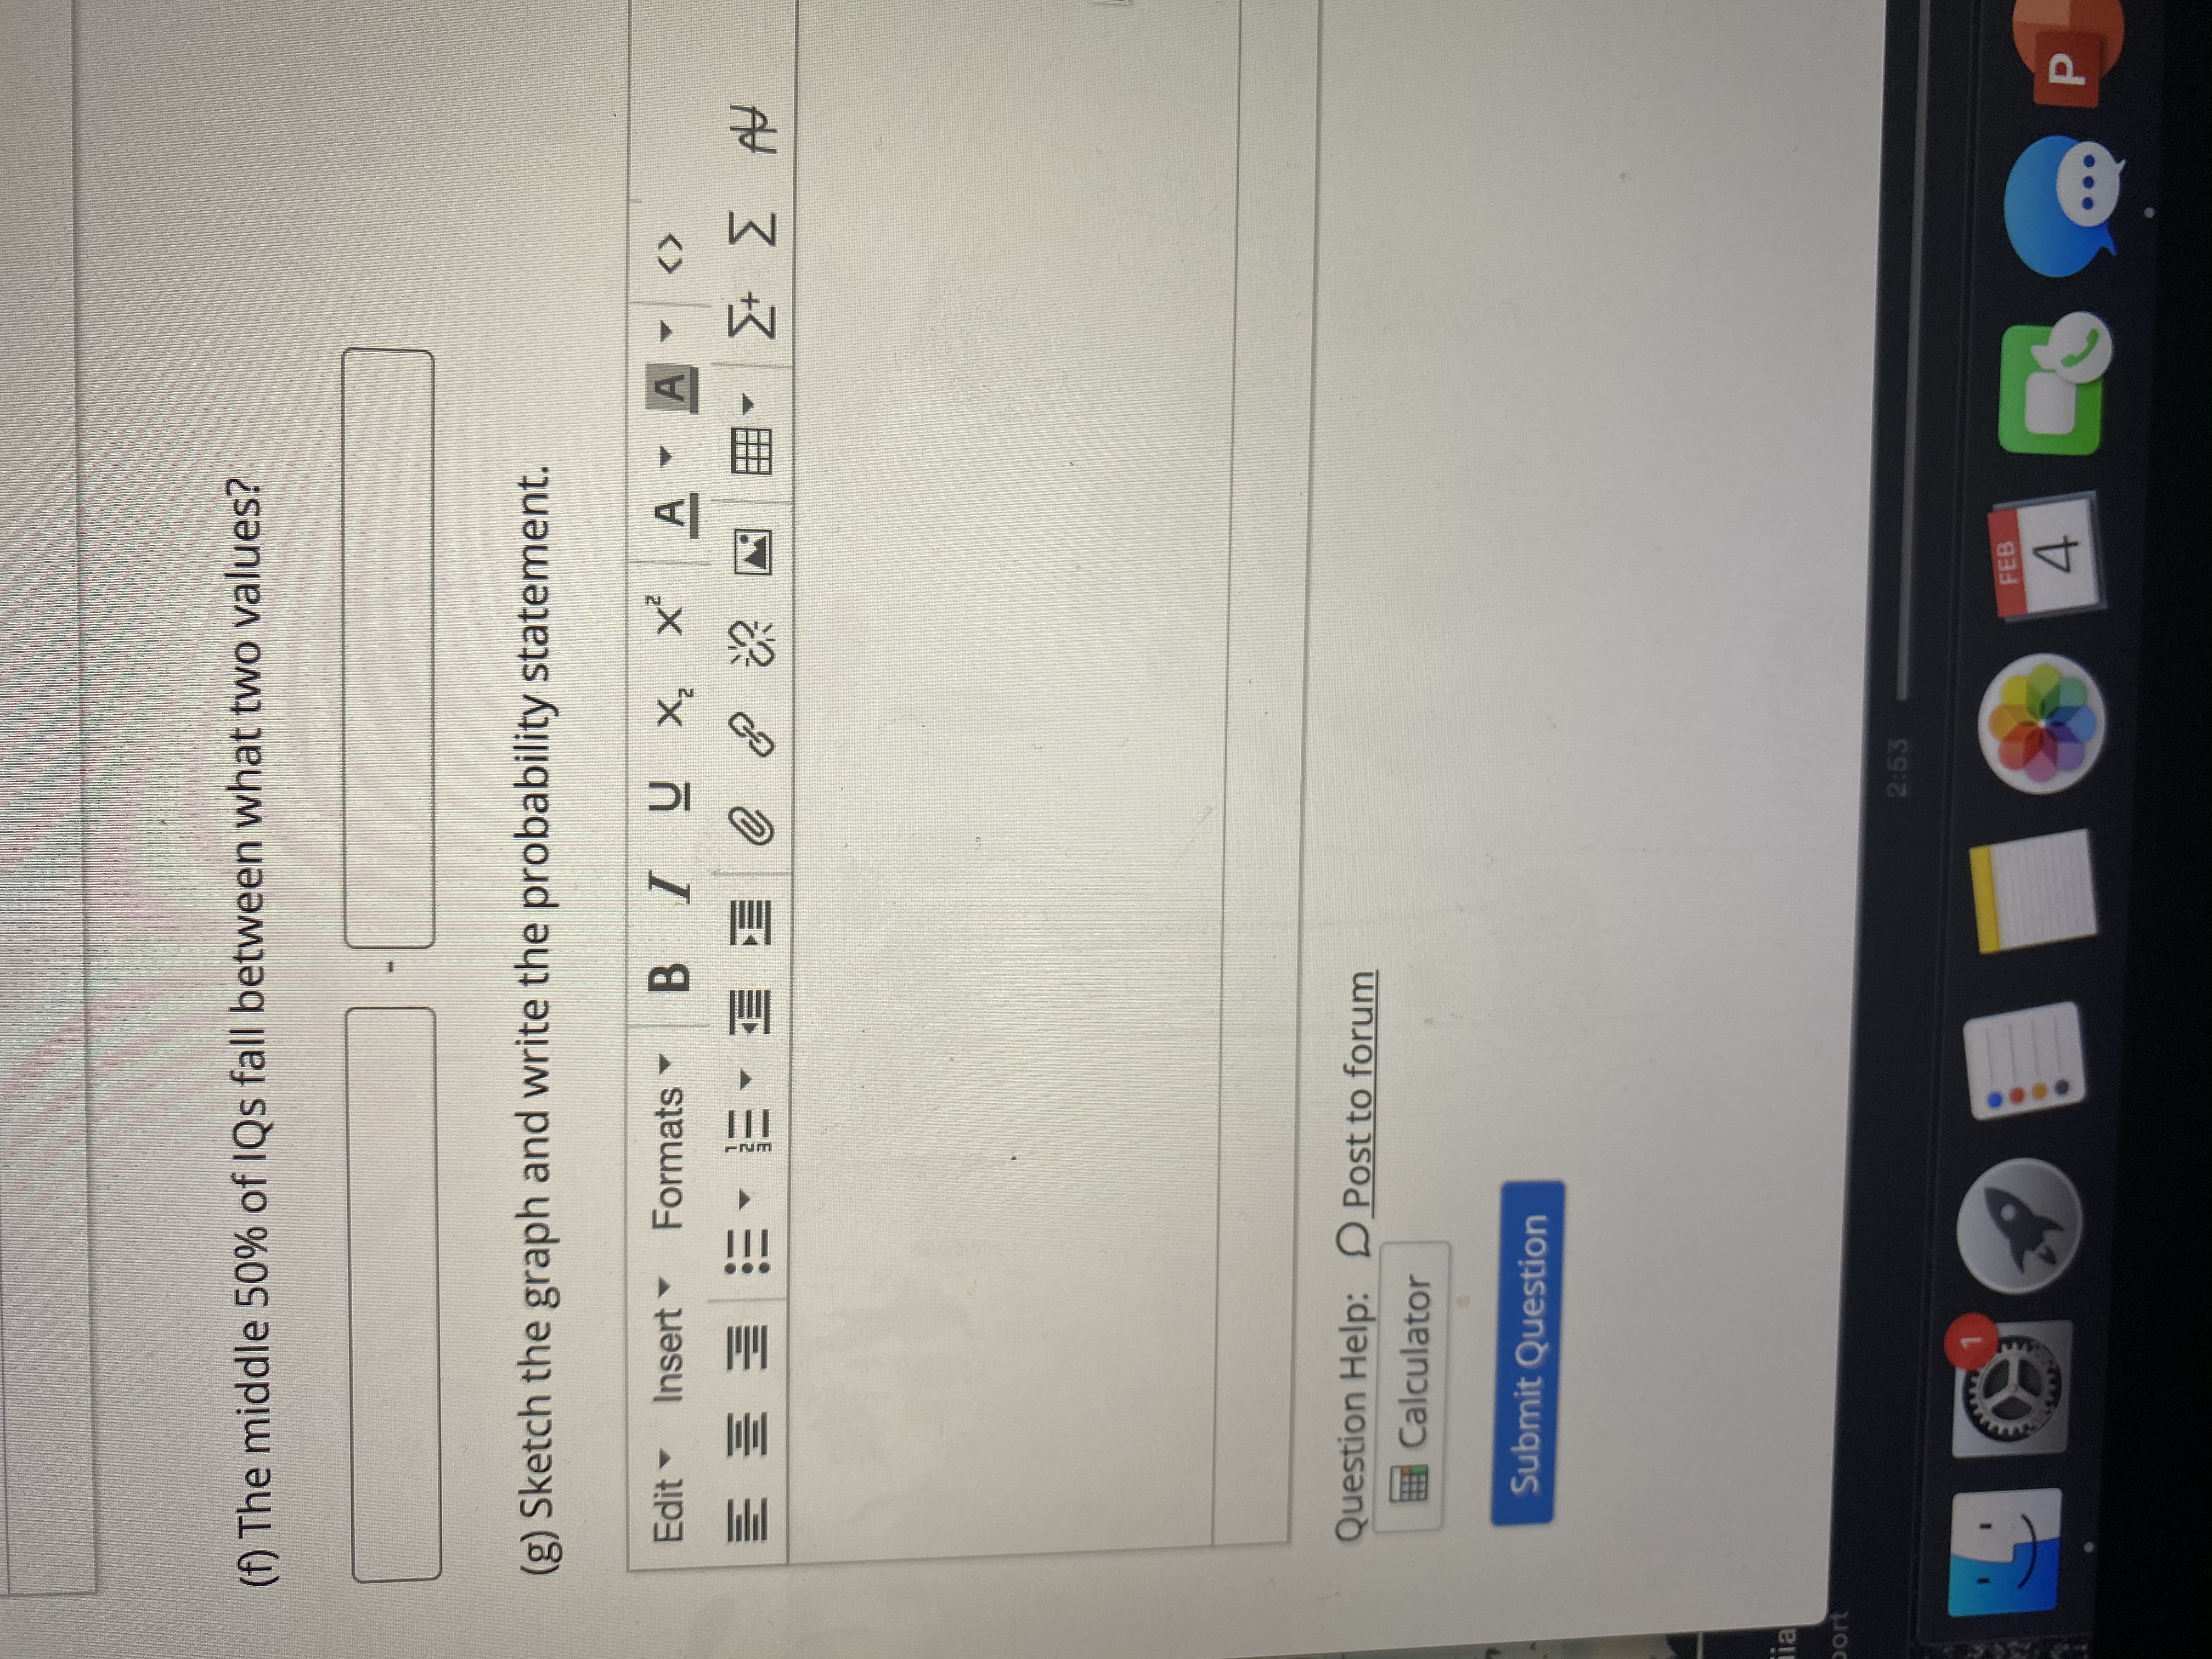
(b) Find the probability that the person has an IQ greater than 91.
(c) Shade the area corresponding to this probability in the graph below. (Hint: The x-axis is the z-
score. Use your z-score from part (a), rounded to one decimal place).
Expert Solution
This question has been solved!
Explore an expertly crafted, step-by-step solution for a thorough understanding of key concepts.

This is a popular solution

Trending nowThis is a popular solution!

Step by stepSolved in 2 steps with 1 images

Knowledge Booster


Learn more about
Need a deep-dive on the concept behind this application? Look no further. Learn more about this topic, statistics and related others by exploring similar questions and additional content below.Similar questions
- Find the indicated IQ score. The graph to the right depicts IQ scores of adults, and those scores are normally distributed with a mean of 100 and a standard deviation of 15. 2 The indicated IQ score, x, is. (Round to one decimal place as needed.) W S X H Saladin_25_Ext.pdf mand # 3 8.0 F F3 E D C $ 4 a FA R F Saladin9eAccess....pdf % 5 V T G 6 A B MacBook Air FO D Y H PBSC A&P 2 La....pptx & 7 8 F? U C... N 8 J DII FB 1 M Q PBSC A&P 2 La.....pptx ( 9 K O > O < I дв L F10 P Clear all command ; { = [ Check answer ? option 0.9 Show All 24 DO x I 1 \ delarrow_forwardFind the area of the shaded region. The graph to the right depicts IQ scores of adults, and those scores are normally distributed with a mean of 100 and a standard deviation of 15. 91 The area of the shaded region is . (Round to four decimal places as needed.)arrow_forwardFind the area of the shaded region. The graph to the right depicts IQ scores of adults, and those scores are normally distributed with a mean of 100 and a standard deviation of 15. A graph with a bell-shaped curve, divided into 3 regions by 2 lines from top to bottom, one on the left side and one on the right side. The region between the lines is shaded. Moving from left to right, the x-axis below the first line is labeled 75. The x-axis below the second line is labeled 110.arrow_forward
- 125 OKarrow_forwardUse the formula to find the standard error of the distribution of differences in sample means, x¯1-x¯2.Samples of size 115 from Population 1 with mean 94 and standard deviation 14 and samples of size 85 from Population 2 with mean 75 and standard deviation 17Round your answer for the standard error to two decimal places.standard error = Enter your answer in accordance to the question statementarrow_forwardSuppose that the distance of fly balls hit to the outfield (in baseball) is normally distributed with a mean of 250 feet and a standard deviation of 48 feet. We randomly sample 49 fly balls. Part A. B. C. are listed in the included images.arrow_forward
- Assume that adults have 1Q scores that are normally distributed with a mean of 103.1 and a standard deviation of 24.4. Find the probability that a randomly selected adult has an IQ greater than 131.3. (Hint: Drawa graph.) The probability that a randomly selected adult from this group has an IQ greater than 131.3 is (Round to four decimal places as needed.)arrow_forwardFind the area of the shaded region. The graph to the right depicts IQ scores of adults, and those scores are normally distributed with a mean of 100 and a standard deviation of 15. Click to view page 1 of the table, Click to view page 2 of the table. Step 1 теan(u) s tan dard o 90 115 The area of the shaded region is (Round to four decimal places as needed.) Step 2 Required pr X-µ = P = P (Z < 1 = P (Z < 2 = 0.9773 Enter your answer in the answer box and then click Check Answer. %3D All parts showing Clear All Final Check P Type here to search hparrow_forwardAssume that the mean height of men in the United States is 70 inches, with a standard deviation of 3 inches. A particular man is 80 inches tall. Find the z-score of his height. (Round to two decimal places.)arrow_forward
arrow_back_ios
arrow_forward_ios
Recommended textbooks for you
- MATLAB: An Introduction with ApplicationsStatisticsISBN:9781119256830Author:Amos GilatPublisher:John Wiley & Sons Inc
 Probability and Statistics for Engineering and th...StatisticsISBN:9781305251809Author:Jay L. DevorePublisher:Cengage Learning
 Statistics for The Behavioral Sciences (MindTap C...StatisticsISBN:9781305504912Author:Frederick J Gravetter, Larry B. WallnauPublisher:Cengage Learning
  Elementary Statistics: Picturing the World (7th E...StatisticsISBN:9780134683416Author:Ron Larson, Betsy FarberPublisher:PEARSON
 The Basic Practice of StatisticsStatisticsISBN:9781319042578Author:David S. Moore, William I. Notz, Michael A. FlignerPublisher:W. H. Freeman
 Introduction to the Practice of StatisticsStatisticsISBN:9781319013387Author:David S. Moore, George P. McCabe, Bruce A. CraigPublisher:W. H. Freeman
MATLAB: An Introduction with Applications
Statistics
ISBN:9781119256830
Author:Amos Gilat
Publisher:John Wiley & Sons Inc
Probability and Statistics for Engineering and th...
Statistics
ISBN:9781305251809
Author:Jay L. Devore
Publisher:Cengage Learning
Statistics for The Behavioral Sciences (MindTap C...
Statistics
ISBN:9781305504912
Author:Frederick J Gravetter, Larry B. Wallnau
Publisher:Cengage Learning
Elementary Statistics: Picturing the World (7th E...
Statistics
ISBN:9780134683416
Author:Ron Larson, Betsy Farber
Publisher:PEARSON
The Basic Practice of Statistics
Statistics
ISBN:9781319042578
Author:David S. Moore, William I. Notz, Michael A. Fligner
Publisher:W. H. Freeman
Introduction to the Practice of Statistics
Statistics
ISBN:9781319013387
Author:David S. Moore, George P. McCabe, Bruce A. Craig
Publisher:W. H. Freeman