close
Homework Help is Here – Start Your Trial Now!
arrow_forward
Literature guides
Concept explainers
Writing guide
Popular textbooks
Popular high school textbooks
Popular Q&A
Business
Accounting
Business Law
Economics
Finance
Leadership
Management
Marketing
Operations Management
Engineering
AI and Machine Learning
Bioengineering
Chemical Engineering
Civil Engineering
Computer Engineering
Computer Science
Cybersecurity
Data Structures and Algorithms
Electrical Engineering
Mechanical Engineering
Language
Spanish
Math
Advanced Math
Algebra
Calculus
Geometry
Probability
Statistics
Trigonometry
Science
Advanced Physics
Anatomy and Physiology
Biochemistry
Biology
Chemistry
Earth Science
Health & Nutrition
Health Science
Nursing
Physics
Social Science
Anthropology
Geography
History
Political Science
Psychology
Sociology
learn
writing tools
expand_more
plus
study resources
expand_more
Log In
Sign Up
expand_more
menu
SEARCH
Homework help starts here!
ASK AN EXPERT
ASK
Math
Statistics
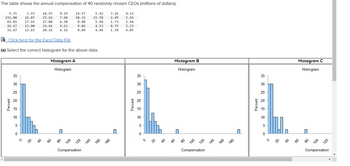
192.00 16.07 23.62 7.60 82.81 17.55 27.08 6.38 26.67 13.00 19.41 4.63 31.47 12.83 20.16 6.16 Percent Click here for the Excel Data File a) Select the correct histogram for the above data. Histogram A Histogram 35 30 25 15 10 5 0 10.32 8.88 9.86 8.89 n 120 Compensation 15.58 2.49 5.56 1.73 5.94 5.98 4.53 0.79 2.23 4.46 1.38 4.05 140 160 180 П Percent 351 30 25 20 15 10 5 0 Histogram B Histogram Compensation 140 160 180 Percent 35 30 25 15 10 5 0 Histogram C Histogram 100 120 Compensation
BUY
College Algebra (MindTap Course List)
12th Edition
ISBN:
9781305652231
Author: R. David Gustafson, Jeff Hughes
Publisher:
Cengage Learning
expand_less
0 A Review Of Basic Algebra
1 Equations And Inequalities
2 Functions And Graphs
3 Functions
4 Polynomial And Rational Functions
5 Exponential And Logarithmic Functions
6 Linear Systems
7 Conic Sections And Quadratic Systems
8 Sequences, Series, And Probability
expand_more
4.1 Quadratic Functions
4.2 Polynomial Functions
4.3 The Remainder And Factor Theorems; Synthetic Division
4.4 Fundamental Theorem Of Algebra And Descartes' Rule Of Signs
4.5 Zeros Of Polynomial Functions
4.6 Rational Functions
4.CR Chapter Review
4.CT Chapter Test
expand_more
Problem 1SC: Find the domain of f(x)=2x3x2x2.
Problem 2SC
Problem 3SC
Problem 4SC
Problem 5SC
Problem 6SC
Problem 7SC: Graph the function: f(x)=1x(x2)2.
Problem 8SC
Problem 9SC
Problem 10SC: Graph: f(x)=x2+x12x+4.
Problem 11SC: Find the mean hourly cost when the cell phone described above is used for 240 minutes.
Problem 1E: Fill in the blanks. When a graph approaches a vertical line but never touches it, we call the line...
Problem 2E
Problem 3E: Fill in the blanks. To find a _________ asymptote of a rational function in simplest form, set the...
Problem 4E: Fill in the blanks. To find the _________ of a rational function, let x=0 and solve for y or find...
Problem 5E: Fill in the blanks. To find the _________ of a rational function, set the numerator equal to 0 and...
Problem 6E: Fill in the blanks. In the function f(x)=P(x)Q(x), if the degree of P(x) is less than the degree of...
Problem 7E: Fill in the blanks. In the function f(x)=P(x)Q(x), if the degree of P(x) and Q(x) are the _______,...
Problem 8E: Fill in the blanks. In a rational function, if the degree of the numerator is 1 greater than the...
Problem 9E: Fill in the blanks. A graph can cross a _______ asymptote but can never cross a _______ asymptote.
Problem 10E: Fill in the blanks. The graph of f(x)=x24x+2 will have a ________ point.
Problem 11E: Find the equations of the vertical and horizontal asymptotes of each graph. Find the domain and...
Problem 12E
Problem 13E
Problem 14E
Problem 15E
Problem 16E
Problem 17E
Problem 18E
Problem 19E
Problem 20E: Suppose the cost in dollars of removing p of the pollution in a river is given by the function...
Problem 21E: Find the domain of each rational function. Do not graph the function. f(x)=x2x2
Problem 22E
Problem 23E: Find the domain of each rational function. Do not graph the function. f(x)=2x2+7x2x225
Problem 24E
Problem 25E
Problem 26E
Problem 27E
Problem 28E
Problem 29E: Find the vertical asymptotes, if any, of each rational function. Do not graph the function. f(x)=xx3
Problem 30E: Find the vertical asymptotes, if any, of each rational function. Do not graph the function....
Problem 31E: Find the vertical asymptotes, if any, of each rational function. Do not graph the function....
Problem 32E: Find the vertical asymptotes, if any, of each rational function. Do not graph the function....
Problem 33E: Find the vertical asymptotes, if any, of each rational function. Do not graph the function....
Problem 34E: Find the vertical asymptotes, if any, of each rational function. Do not graph the function....
Problem 35E: Find the vertical asymptotes, if any, of each rational function. Do not graph the function....
Problem 36E: Find the vertical asymptotes, if any, of each rational function. Do not graph the function....
Problem 37E: Find the horizontal asymptotes, if any, of each rational function. Do not graph the function....
Problem 38E: Find the horizontal asymptotes, if any, of each rational function. Do not graph the function....
Problem 39E: Find the horizontal asymptotes, if any, of each rational function. Do not graph the function....
Problem 40E: Find the horizontal asymptotes, if any, of each rational function. Do not graph the function....
Problem 41E: Find the horizontal asymptotes, if any, of each rational function. Do not graph the function....
Problem 42E: Find the horizontal asymptotes, if any, of each rational function. Do not graph the function....
Problem 43E: Find the horizontal asymptotes, if any, of each rational function. Do not graph the function....
Problem 44E: Find the horizontal asymptotes, if any, of each rational function. Do not graph the function....
Problem 45E: Find the slant asymptotes, if any, of each rational function. Do not graph the function....
Problem 46E: Find the slant asymptotes, if any, of each rational function. Do not graph the function....
Problem 47E: Find the slant asymptotes, if any, of each rational function. Do not graph the function....
Problem 48E: Find the slant asymptotes, if any, of each rational function. Do not graph the function....
Problem 49E: Find the slant asymptotes, if any, of each rational function. Do not graph the function....
Problem 50E: Find the slant asymptotes, if any, of each rational function. Do not graph the function....
Problem 51E: Graph each rational function. Check your work with a graphing calculator. y=1x2
Problem 52E: Graph each rational function. Check your work with a graphing calculator. y=3x+3
Problem 53E: Graph each rational function. Check your work with a graphing calculator. y=xx1
Problem 54E: Graph each rational function. Check your work with a graphing calculator. y=xx+2
Problem 55E: Graph each rational function. Check your work with a graphing calculator. y=x+1x+2
Problem 56E: Graph each rational function. Check your work with a graphing calculator. f(x)=x1x2
Problem 57E: Graph each rational function. Check your work with a graphing calculator. f(x)=2x1x1
Problem 58E: Graph each rational function. Check your work with a graphing calculator. f(x)=3x+2x24
Problem 59E: Graph each rational function. Check your work with a graphing calculator. g(x)=x29x24
Problem 60E: Graph each rational function. Check your work with a graphing calculator. g(x)=x24x29
Problem 61E: Graph each rational function. Check your work with a graphing calculator. g(x)=x2x2x24x+3
Problem 62E: Graph each rational function. Check your work with a graphing calculator. g(x)=x2+7x+12x27x+12
Problem 63E: Graph each rational function. Check your work with a graphing calculator. y=x2+2x3x34x
Problem 64E: Graph each rational function. Check your work with a graphing calculator. y=3x24x+12x3+3x2+x
Problem 65E: Graph each rational function. Check your work with a graphing calculator. y=x29x2
Problem 66E: Graph each rational function. Check your work with a graphing calculator. y=3x212x2
Problem 67E: Graph each rational function. Check your work with a graphing calculator. f(x)=x(x+3)2
Problem 68E: Graph each rational function. Check your work with a graphing calculator. f(x)=x(x1)2
Problem 69E: Graph each rational function. Check your work with a graphing calculator. f(x)=x+1x2(x2)
Problem 70E: Graph each rational function. Check your work with a graphing calculator. f(x)=x1x2(x+2)2
Problem 71E: Graph each rational function. Check your work with a graphing calculator. y=xx2+1
Problem 72E: Graph each rational function. Check your work with a graphing calculator. y=x1x2+2
Problem 73E: Graph each rational function. Check your work with a graphing calculator. y=3x2x2+1
Problem 74E: Graph each rational function. Check your work with a graphing calculator. y=x292x2+1
Problem 75E: Graph each rational function. Check your work with a graphing calculator. h(x)=x22x8x1
Problem 76E: Graph each rational function. Check your work with a graphing calculator. h(x)=x2+x6x+2
Problem 77E: Graph each rational function. Check your work with a graphing calculator. f(x)=x3+x2+6xx21
Problem 78E: Graph each rational function. Check your work with a graphing calculator. f(x)=x32x2+xx24
Problem 79E: Graph each rational function. Note that the numerator and denominator of the fraction share a common...
Problem 80E
Problem 81E
Problem 82E
Problem 83E: Graph each rational function. Note that the numerator and denominator of the fraction share a common...
Problem 84E
Problem 85E: Graph each rational function. Note that the numerator and denominator of the fraction share a common...
Problem 86E
Problem 87E
Problem 88E: An electric company charges 10 per month plus 20 for each kilowatt-hour kwh of electricity used. a....
Problem 89E
Problem 90E
Problem 91E
Problem 92E
Problem 93E
Problem 94E
Problem 95E
Problem 96E
Problem 97E
Problem 98E
Problem 99E
Problem 100E
Problem 101E
Problem 102E
Problem 103E
Problem 104E
Problem 105E
Problem 106E
Problem 107E
Problem 108E
Problem 109E: Determine if the statement is true or false. If the statement is false, then correct it and make it...
Problem 110E
format_list_bulleted
See similar textbooks
Related questions
Q: the following data set represents the number of new computer accounts registered during 5…
A:
Q: find 75th percentile for given data 25,89,63,4,5,42,65,63,54,41,68,98,9,75,25,15,49
A:
Q: The Inter Quartile Range is the difference between the third and first quartiles. It describes the…
A: WE have to find given probability.
Q: Find the mean, median, and mode of the following data. If necessary, round to one more decimal place…
A:
Q: The following refer to the following data set: 91.8 62.4 69.9 70.2 91.8 57.1 91.8 77.2 75.2 82.8…
A:
Q: Calculate the 50th percentile of the data shown x 1.9 2.8 5.4 6 6.1 6.4 8.1 8.8 9.1 16 16.3 17.3…
A: Given information- We have given a data set- X – 1.9, 2.8, 5.4, 6, 6.1, 6.4, 8.1, 8.8, 9.1, 16,…
Q: Calculate the 23th percentile of the data shown x 26.8 27.3 30.9 33 33.9 34.9 39.7 53.4 53.8 69.2
A: The provided information is as follows:26.827.330.93333.934.939.753.453.869.2The number of…
Q: The accompanying data are lengths (inches) of bears. Find the percentile corresponding to 68.0 in.…
A: Data is given We have to calculate Percentile corresponding to 68.0 In data, 68.0 is at 43rd…
Q: Calculate the 10th percentile of the data shown 3.4 12.1 14.4 18.3 18.9 21.4 28.9 29.8
A: From the provided information, The total number of observations = 8 The location of 10th percentile…
Q: Find the mean, median, and mode of the following data. If necessary round to one more decimal place…
A:
Q: Find the 94th percentile, P94, from the following data 1 2 3 5 9 11 16 23 24 28 30 31 33 34 38 39…
A: Arrange the given data in an ascending order.…
Q: The accompanying data are lengths (inches) of bears. Find the percentile corresponding to 61.5 in.…
A: We know the data(x) of lengths(in inches) of bears. 36.0, 37.5, 39.5, 40.0, 41.0, 42.5, 44.0, 45.5,…
Q: 5.5 5.7 5.8 5.9 6.1 6.1 6.4 6.4 6.5 6.6 6.7 6.7 6.7 6.9 7.0 7.0 7.0 7.1 7.2 7.2 7.4 7.5 7.7 7.7 7.8…
A: 5.5,5.7,5.8,5.9,6.1,6.1,6.4,6.4,6.5,6.6, 6.7,6.7,6.7,6.9,7.0,7.0,7.0,7.1,7.2,7.2,…
Q: How to find the Mean, Median, and Mode for this specific table? Table is Ordinal.
A: For ordinal data mean cannot be found as it require an arithmetic operation like addition and…
Q: Obtain the five-number summary for the given data. The normal annual precipitation (in inches) is…
A: Use EXCEL Procedure to obtain the value of first quartile. Follow the instruction to obtain the…
Q: A sample of college students was asked how much they spent monthly on cell phone plans. Approximate…
A:
Q: Use the data in the table to the right to answer the following questions. Weights (g) of a Sample…
A: Given that The weights of sample bag of candy. Number of red candies = 10 Number of blue candies =…
Q: Table 1 22 33 37 53 57 69 85 102 106 112 23 33 38 53 59 70 86 104 107 112 24 35 41 54 61 70 101 105…
A: Since you have posted a question with multiple subparts, we will solve first three subparts for you.…
Q: Find the 5 number summary for the data shown X 5.4 7 7.1 9.2 13.8 17 19.9 21.9 23.3 26.1 5 number…
A: The question is about 5 no. summary Given : To find : 5 no. summary for given data
Q: The top 14 speeds, in miles per hour, for Pro-Stock drag racing over the past two decades are…
A: Calculate Mean from the following…
Question
Transcribed Image Text:
The table shows the annual compensation of 40 randomly chosen CEOs (millions of dollars). 5.35 1.93 192.00 16.07 17.55 13.00 24.93 8.19 23.62 7.60 27.08 6.38 19.41 4.63 82.81 26.67 31.47 12.83 20.16 6.16 Click here for the Excel Data File Percent (a) Select the correct histogram for the above data. Histogram A Histogram 35 30 25 20 15 10 5 0 40 60 80 14.57 10.32 8.88 9.86 8.89 100 120 Compensation 5.42 3.26 15.58 2.49 5.98 1.73 4.53 0.79 4.46 1.38 140 160 180 4.12 5.56 5.94 2.23 4.05 Percent 35 30 25 20 15 10 5 0 Histogram B Histogram 80 100 120 Compensation 140 160 180 Percent 35 30 25 20 15 10 5 0 20 40 Histogram C Histogram 80 100 120 Compensation
Expert Solution
This question has been solved!
Explore an expertly crafted, step-by-step solution for a thorough understanding of key concepts.
See solution
Check out a sample Q&A here
Step 1
VIEW
Step 2
VIEW
Step by step
Solved in 2 steps with 1 images
See solution
Check out a sample Q&A here
Knowledge Booster
Similar questions
Find the mean hourly cost when the cell phone described above is used for 240 minutes.
arrow_forward
Recommended textbooks for you
arrow_back_ios
arrow_forward_ios
College Algebra (MindTap Course List)
Algebra
ISBN:
9781305652231
Author:
R. David Gustafson, Jeff Hughes
Publisher:
Cengage Learning
Glencoe Algebra 1, Student Edition, 9780079039897...
Algebra
ISBN:
9780079039897
Author:
Carter
Publisher:
McGraw Hill
Holt Mcdougal Larson Pre-algebra: Student Edition...
Algebra
ISBN:
9780547587776
Author:
HOLT MCDOUGAL
Publisher:
HOLT MCDOUGAL
Big Ideas Math A Bridge To Success Algebra 1: Stu...
Algebra
ISBN:
9781680331141
Author:
HOUGHTON MIFFLIN HARCOURT
Publisher:
Houghton Mifflin Harcourt
SEE MORE TEXTBOOKS