
MATLAB: An Introduction with Applications
6th Edition
ISBN: 9781119256830
Author: Amos Gilat
Publisher: John Wiley & Sons Inc
expand_more
expand_more
format_list_bulleted
Related questions
Question
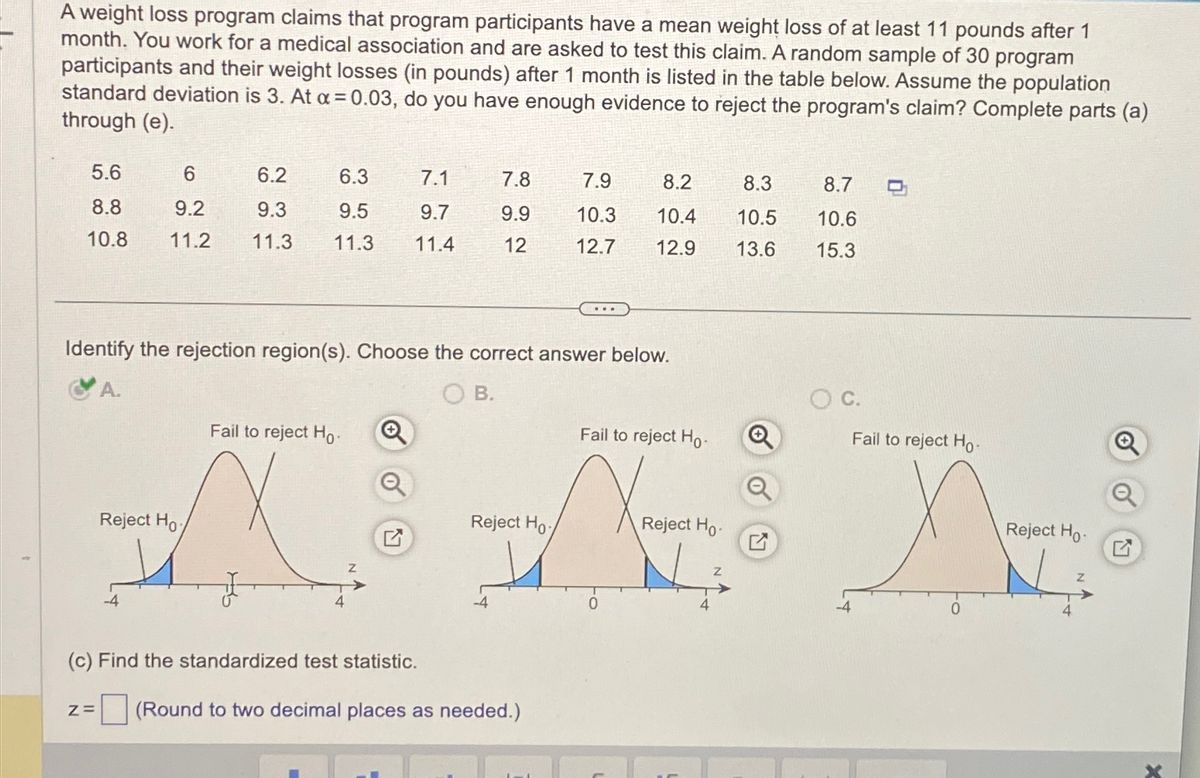

Transcribed Image Text:A weight loss program claims that program participants have a mean weight loss of at least 11 pounds after 1
month. You work for a medical association and are asked to test this claim. A random sample of 30 program
participants and their weight losses (in pounds) after 1 month is listed in the table below. Assume the population
standard deviation is 3. At a = 0.03, do you have enough evidence to reject the program's claim? Complete parts (a)
through (e).
5.6
6
6.2
6.3
7.1
7.8
7.9
8.2
8.3
8.7
D
8.8
9.2
9.3
9.5
9.7
9.9
10.3
10.4
10.5
10.6
10.8
11.2
11.3
11.3
11.4
12
12.7
12.9
13.6
15.3
Identify the rejection region(s). Choose the correct answer below.
A.
OB.
○ C.
Fail to reject Ho
Q
Fail to reject Ho
Fail to reject Ho
Reject Ho
Reject Ho
Reject Ho
(c) Find the standardized test statistic.
Z=
☐ (Round to two decimal places as needed.)
Reject Ho
Expert Solution
This question has been solved!
Explore an expertly crafted, step-by-step solution for a thorough understanding of key concepts.

Step by stepSolved in 4 steps with 13 images

Knowledge Booster

Similar questions
- Pls help ASAP. Pls show all work.arrow_forwardOverweight Men For a random sample of 70 overweight men, the mean of the number of pounds that they were overweight was 32. The standard deviation of the population is 4.4 pounds. Part: 0 / 4 0 of 4 Parts Complete Part 1 of 4 (a) The best point estimate of the mean is how many pounds?arrow_forwardsample sizearrow_forward
- A standardized exam's scores are normally distributed. In a recent year, the mean test score was 20.6 and the standard deviation was 5.6. The test scores of four students selected at random are 13, 23, 7, and 35. Find the z-scores that correspond to each value and determine whether any of the values are unusual. Question content area bottom Part 1 The z-score for 13 is (Round to two decimal places as needed.) Part 2 The z-score for 23 is (Round to two decimal places as needed.) Part 3 The z-score for 7 is (Round to two decimal places as needed.) Part 4 The z-score for 35 is (Round to two decimal places as needed.) Part 5 Which values, if any, are unusual? Select the correct choice below and, if necessary, fill in the answer box within your choice. A. The unusual value(s) is/are (Use a comma to separate answers as needed.) B. None of the values are unusual.arrow_forwardAnswer all these questionsarrow_forwardPls help ASAP. Pls show all work.arrow_forward
- helparrow_forwardNeed help on a and finding the t and p valuearrow_forwardStandardized tests: In a particular year, the mean score on the ACT test was 22.3 and the standard deviation was 5.3. The mean score on the SAT mathematics test was 504 and the standard deviation was 100. The distributions of both scores were approximately bell-shaped. Round the answers to at least two decimal places. Find the z-score for an ACT score of 30.arrow_forward
- 450 Chapter 8 Hypothesis Testing 14. Internet Visits A U.S. Web Usage Snapshot indicated a monthly average of 36 Internet visits a particular website per user from home. A random sample of 24 Internet users yielded a sample mean of 42.1 visits with a standard deviation of 5.3. At the 0.01 level of significance, can it be concluded that this differs from the national average? Source: New York Times Almanac.arrow_forwardI need help solvingarrow_forwardThe Intelligence Quotient (IQ) test scores for adults are normally distributed with a population mean of 100 and a population standard deviation of 20. What is the probability we could select a sample of 20 adults and find the mean of this sample is less than 95? 0.1314 0.7372 0.3686 0.7098arrow_forward
arrow_back_ios
SEE MORE QUESTIONS
arrow_forward_ios
Recommended textbooks for you
- MATLAB: An Introduction with ApplicationsStatisticsISBN:9781119256830Author:Amos GilatPublisher:John Wiley & Sons Inc
 Probability and Statistics for Engineering and th...StatisticsISBN:9781305251809Author:Jay L. DevorePublisher:Cengage Learning
 Statistics for The Behavioral Sciences (MindTap C...StatisticsISBN:9781305504912Author:Frederick J Gravetter, Larry B. WallnauPublisher:Cengage Learning
  Elementary Statistics: Picturing the World (7th E...StatisticsISBN:9780134683416Author:Ron Larson, Betsy FarberPublisher:PEARSON
 The Basic Practice of StatisticsStatisticsISBN:9781319042578Author:David S. Moore, William I. Notz, Michael A. FlignerPublisher:W. H. Freeman
 Introduction to the Practice of StatisticsStatisticsISBN:9781319013387Author:David S. Moore, George P. McCabe, Bruce A. CraigPublisher:W. H. Freeman
MATLAB: An Introduction with Applications
Statistics
ISBN:9781119256830
Author:Amos Gilat
Publisher:John Wiley & Sons Inc
Probability and Statistics for Engineering and th...
Statistics
ISBN:9781305251809
Author:Jay L. Devore
Publisher:Cengage Learning
Statistics for The Behavioral Sciences (MindTap C...
Statistics
ISBN:9781305504912
Author:Frederick J Gravetter, Larry B. Wallnau
Publisher:Cengage Learning
Elementary Statistics: Picturing the World (7th E...
Statistics
ISBN:9780134683416
Author:Ron Larson, Betsy Farber
Publisher:PEARSON
The Basic Practice of Statistics
Statistics
ISBN:9781319042578
Author:David S. Moore, William I. Notz, Michael A. Fligner
Publisher:W. H. Freeman
Introduction to the Practice of Statistics
Statistics
ISBN:9781319013387
Author:David S. Moore, George P. McCabe, Bruce A. Craig
Publisher:W. H. Freeman