
MATLAB: An Introduction with Applications
6th Edition
ISBN: 9781119256830
Author: Amos Gilat
Publisher: John Wiley & Sons Inc
expand_more
expand_more
format_list_bulleted
Related questions
Question
Q17
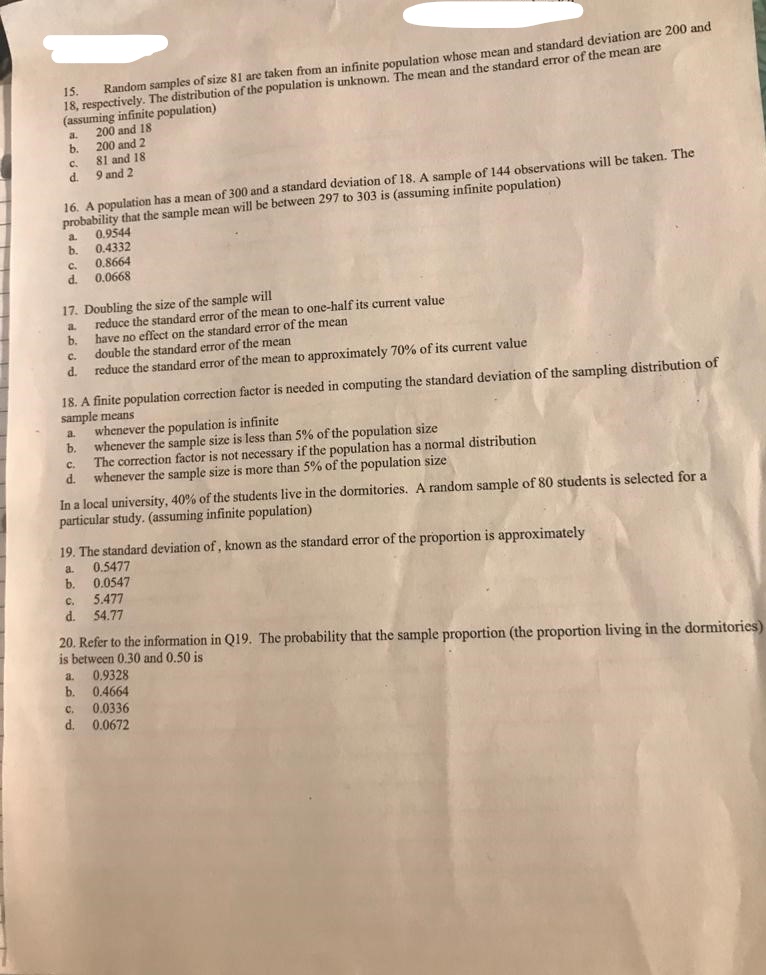

Transcribed Image Text:18, respectively. The distribution of the population is unknown. The mean and the standard error of the mean are
(assuming infinite population)
200 and 18
b.
15.
Random samples of size 81 are taken from an infinite population whose mean and standard deviation are 200 and
a.
200 and 2
81 and 18
C.
d.
9 and 2
16. A population has a mean of 300 and a standard deviation of 18. A sample of 144 observations will be taken. The
probability that the sample mean will be between 297 to 303 is (assuming infinite population)
0.9544
0.4332
a.
b.
0.8664
C.
0.0668
d.
17. Doubling the size of the sample will
reduce the standard error of the mean to one-half its current value
b.
a
have no effect on the standard error of the mean
double the standard error of the mean
reduce the standard error of the mean to approximately 70% of its current value
C.
d.
18. A finite population correction factor is needed in computing the standard deviation of the sampling distribution of
sample means
whenever the population is infinite
b.
a.
whenever the sample size is less than 5% of the population size
The correction factor is not necessary if the population has a normal distribution
d.
C.
whenever the sample size is more than 5% of the population size
In a local university, 40% of the students live in the dormitories. A random sample of 80 students is selected for a
particular study. (assuming infinite population)
19. The standard deviation of, known as the standard error of the proportion is approximately
0.5477
b.
a.
0.0547
C.
5.477
d.
54.77
20. Refer to the information in Q19. The probability that the sample proportion (the proportion living in the dormitories)
is between 0.30 and 0.50 is
0.9328
b. 0.4664
a.
C.
0.0336
d. 0.0672
Expert Solution
This question has been solved!
Explore an expertly crafted, step-by-step solution for a thorough understanding of key concepts.

This is a popular solution

Trending nowThis is a popular solution!

Step by stepSolved in 2 steps with 1 images

Knowledge Booster

Similar questions
- Match these values of r with the accompanying scatterplots: -0.396, -0.766, - 1,0.766, and 0.997 Click the icon to view the scatterplots, Match the values of r to the scatterplots. Scatterplot 1, r= Scatterplot 2, r= Scatterplot 3, r= Scatterplot 4, r= Scatterplot 5, r=arrow_forwardMatch these values of r with the accompanying scatterplots: - 0.994, 0.76, 0.994, - 0.374, and - 0.76. Click the icon to view the scatterplots. Match the values of r to the scatterplots. i Scatterplots Scatterplot 1, r= Scatterplot 2, r= Scatterplot 3, r = Scatterplot 1 Scatterplot 2 Scatterplot 3 Scatterplot 4, r= 8- 8- 8- Scatterplot 5, r = 6- 6- 6- > 4- 4- 4- 2- 2- 2- 0+ 0- 0- 0.2 0.4 0.6 0.8 1 0.2 0.4 0.6 0.8 1 0.2 0.4 0.6 0.8 1 Scatterplot 4 Scatterplot 5 8- 6- -2- -4– > 4- -6- 2- -8- 04 0.2 0.4 0.6 0.8 1 0.2 0.4 0.6 0.8 1 X of of of of ofarrow_forwardA bag contains 3 red balls, 2 yellow balls, 2 green balls. Suppose that you pick three balls at random (without replacement). Let R denote the number of red balls and Y the number of yellow balls. Find E(R²Y³).arrow_forward
- Match these values of r with the accompanying scatterplots: 1, - 0.996, - 0.743, 0.996, and 0.358. Click the icon to view the scatterplots. i Scatterplots Match the values of r to the scatterplots. Scatterplot 1, r = Scatterplot 2, r = Scatterplot 1 Scatterplot 2 Scatterplot 3 Scatterplot 3, r = 15- 0- 8- . Scatterplot 4, r= 14- -2- 6- 13- Scatterplot 5, r= -4- 4- 12- -6– 11- 2- -8- 1 104 0- 0.2 0.4 0.6 0.8 1 0.2 0.4 0.6 0.8 1 0.2 0.4 0.6 0.8 1 - 0.743 0.996 Scatterplot 4 Scatterplot 5 - 0.996 8- 8- 0.358 6- 6- > 4- 4- 2- 2- 0+ 0- 0.2 0.4 0.6 0.8 1 0.2 0.4 0.6 0.8 1arrow_forwardFor each of the following, factor the matrix A into a product QDQ" where Q is orthogonal and D is diagonal. -7 1 1 (a) A = -1 -7 1 -7 -1 D = -4 -2 2 (b) A = -2 -3 2 3 -3 D = || ||arrow_forward
arrow_back_ios
arrow_forward_ios
Recommended textbooks for you
- MATLAB: An Introduction with ApplicationsStatisticsISBN:9781119256830Author:Amos GilatPublisher:John Wiley & Sons Inc
 Probability and Statistics for Engineering and th...StatisticsISBN:9781305251809Author:Jay L. DevorePublisher:Cengage Learning
 Statistics for The Behavioral Sciences (MindTap C...StatisticsISBN:9781305504912Author:Frederick J Gravetter, Larry B. WallnauPublisher:Cengage Learning
  Elementary Statistics: Picturing the World (7th E...StatisticsISBN:9780134683416Author:Ron Larson, Betsy FarberPublisher:PEARSON
 The Basic Practice of StatisticsStatisticsISBN:9781319042578Author:David S. Moore, William I. Notz, Michael A. FlignerPublisher:W. H. Freeman
 Introduction to the Practice of StatisticsStatisticsISBN:9781319013387Author:David S. Moore, George P. McCabe, Bruce A. CraigPublisher:W. H. Freeman
MATLAB: An Introduction with Applications
Statistics
ISBN:9781119256830
Author:Amos Gilat
Publisher:John Wiley & Sons Inc
Probability and Statistics for Engineering and th...
Statistics
ISBN:9781305251809
Author:Jay L. Devore
Publisher:Cengage Learning
Statistics for The Behavioral Sciences (MindTap C...
Statistics
ISBN:9781305504912
Author:Frederick J Gravetter, Larry B. Wallnau
Publisher:Cengage Learning
Elementary Statistics: Picturing the World (7th E...
Statistics
ISBN:9780134683416
Author:Ron Larson, Betsy Farber
Publisher:PEARSON
The Basic Practice of Statistics
Statistics
ISBN:9781319042578
Author:David S. Moore, William I. Notz, Michael A. Fligner
Publisher:W. H. Freeman
Introduction to the Practice of Statistics
Statistics
ISBN:9781319013387
Author:David S. Moore, George P. McCabe, Bruce A. Craig
Publisher:W. H. Freeman