
MATLAB: An Introduction with Applications
6th Edition
ISBN: 9781119256830
Author: Amos Gilat
Publisher: John Wiley & Sons Inc
expand_more
expand_more
format_list_bulleted
Related questions
Question
Answer C,D, and E
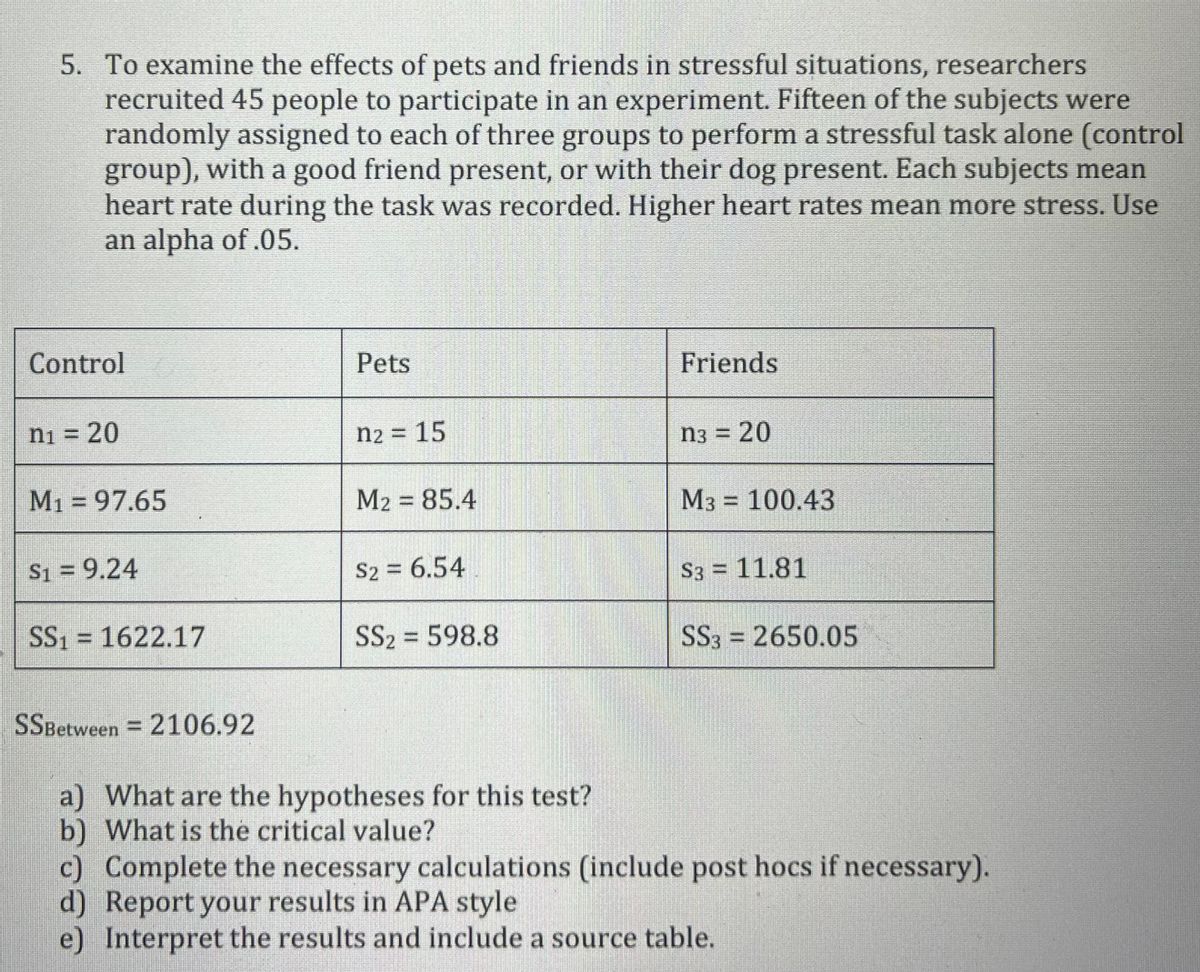

Transcribed Image Text:5. To examine the effects of pets and friends in stressful situations, researchers
recruited 45 people to participate in an experiment. Fifteen of the subjects were
randomly assigned to each of three groups to perform a stressful task alone (control
group), with a good friend present, or with their dog present. Each subjects mean
heart rate during the task was recorded. Higher heart rates mean more stress. Use
an alpha of .05.
Control
Pets
Friends
ni =
20
n2 = 15
n3 =
= 20
M1 = 97.65
M2 = 85.4
M3 = 100.43
S1 = 9.24
S2 = 6.54
S3 = 11.81
SS1 = 1622.17
SS2 = 598.8
SS3 = 2650.05
%3D
SSBetween = 2106.92
a) What are the hypotheses for this test?
b) What is the critical value?
c) Complete the necessary calculations (include post hocs if necessary).
d) Report your results in APA style
e) Interpret the results and include a source table.
Expert Solution
This question has been solved!
Explore an expertly crafted, step-by-step solution for a thorough understanding of key concepts.

Step by stepSolved in 2 steps with 1 images

Knowledge Booster

Similar questions
- Match these values of r with the accompanying scatterplots: 0.402, 0.736, -0.736, -1, and 1. Click the icon to view the scatterplots. Match the values of r to the scatterplots. Scatterplot 1, r= Scatterplot 2, r= Scatterplot 3, r= Scatterplot 4, r = Scatterplot 5, r = V ▼ Scatterplots 15- 14- 13- 12- 11- 10+ 0 8- 6- 4. 2- 0- 0 4 Scatterplot 1 . • 0.2 0.4 0.6 0.8 1 x Scatterplot 4 0.2 0.4 0.6 0.8 x • 1 Q Q Q ✔ 8 6- > 4- 2 ▬▬▬▬▬▬▬▬▬▬o 0- 0 0.2 0.4 0.6 0.8 -14 Scatterplot 2 0 • X Scatterplot 5 1 0.2 0.4 0.6 0.8 1 C Q Q ✔ Q Q > 8- 6- 4- 2 0- 0 0 · Scatterp T 0.2 0.4 0.6 X ▶ Xarrow_forwardMatch these values of r with the accompanying scatterplots: - 0.994, 0.76, 0.994, - 0.374, and - 0.76. Click the icon to view the scatterplots. Match the values of r to the scatterplots. i Scatterplots Scatterplot 1, r= Scatterplot 2, r= Scatterplot 3, r = Scatterplot 1 Scatterplot 2 Scatterplot 3 Scatterplot 4, r= 8- 8- 8- Scatterplot 5, r = 6- 6- 6- > 4- 4- 4- 2- 2- 2- 0+ 0- 0- 0.2 0.4 0.6 0.8 1 0.2 0.4 0.6 0.8 1 0.2 0.4 0.6 0.8 1 Scatterplot 4 Scatterplot 5 8- 6- -2- -4– > 4- -6- 2- -8- 04 0.2 0.4 0.6 0.8 1 0.2 0.4 0.6 0.8 1 X of of of of ofarrow_forwardMatch these values of r with the accompanying scatterplots: 1, - 0.996, - 0.743, 0.996, and 0.358. Click the icon to view the scatterplots. i Scatterplots Match the values of r to the scatterplots. Scatterplot 1, r = Scatterplot 2, r = Scatterplot 1 Scatterplot 2 Scatterplot 3 Scatterplot 3, r = 15- 0- 8- . Scatterplot 4, r= 14- -2- 6- 13- Scatterplot 5, r= -4- 4- 12- -6– 11- 2- -8- 1 104 0- 0.2 0.4 0.6 0.8 1 0.2 0.4 0.6 0.8 1 0.2 0.4 0.6 0.8 1 - 0.743 0.996 Scatterplot 4 Scatterplot 5 - 0.996 8- 8- 0.358 6- 6- > 4- 4- 2- 2- 0+ 0- 0.2 0.4 0.6 0.8 1 0.2 0.4 0.6 0.8 1arrow_forward
- If the temperature is 43 °F, how much time does it take for thecricket to produce 12 chirps?A. 12 s B. 24 s C. 43 s D. 52 sarrow_forwardMatch these values of r with the accompanying scatterplots: 1, 0.997, - 0.405, 0.405, and - 0.761. W Click the icon to view the scatterplots. i Scatterplots Match the values of r to the scatterplots. Scatterplot 1, r= Scatterplot 2, r = Scatterplot 1 Scatterplot 2 Scat Scatterplot 3, r= 8- 8- 8- Scatterplot 4, r = 6- 6- 6- Scatterplot 5, r= > 4- 4- 4- 2- 2- 2- 0+ 0.2 0,4 0,6 0.8 0- 0.2 0.4 0.6 0.8 0+ 0.2 0.4 1 1 Scatterplot 4 Scatterplot 5 15- 8- 14- 6- 13- 4- 12- 11- 2- 10+ ó 0.2 0.4 0.6 0.8 0- 0.2 0.4 0.6 0.8 1 Print Donearrow_forwardFor each of the following, factor the matrix A into a product QDQ" where Q is orthogonal and D is diagonal. -7 1 1 (a) A = -1 -7 1 -7 -1 D = -4 -2 2 (b) A = -2 -3 2 3 -3 D = || ||arrow_forward
arrow_back_ios
arrow_forward_ios
Recommended textbooks for you
- MATLAB: An Introduction with ApplicationsStatisticsISBN:9781119256830Author:Amos GilatPublisher:John Wiley & Sons Inc
 Probability and Statistics for Engineering and th...StatisticsISBN:9781305251809Author:Jay L. DevorePublisher:Cengage Learning
 Statistics for The Behavioral Sciences (MindTap C...StatisticsISBN:9781305504912Author:Frederick J Gravetter, Larry B. WallnauPublisher:Cengage Learning
  Elementary Statistics: Picturing the World (7th E...StatisticsISBN:9780134683416Author:Ron Larson, Betsy FarberPublisher:PEARSON
 The Basic Practice of StatisticsStatisticsISBN:9781319042578Author:David S. Moore, William I. Notz, Michael A. FlignerPublisher:W. H. Freeman
 Introduction to the Practice of StatisticsStatisticsISBN:9781319013387Author:David S. Moore, George P. McCabe, Bruce A. CraigPublisher:W. H. Freeman
MATLAB: An Introduction with Applications
Statistics
ISBN:9781119256830
Author:Amos Gilat
Publisher:John Wiley & Sons Inc
Probability and Statistics for Engineering and th...
Statistics
ISBN:9781305251809
Author:Jay L. Devore
Publisher:Cengage Learning
Statistics for The Behavioral Sciences (MindTap C...
Statistics
ISBN:9781305504912
Author:Frederick J Gravetter, Larry B. Wallnau
Publisher:Cengage Learning
Elementary Statistics: Picturing the World (7th E...
Statistics
ISBN:9780134683416
Author:Ron Larson, Betsy Farber
Publisher:PEARSON
The Basic Practice of Statistics
Statistics
ISBN:9781319042578
Author:David S. Moore, William I. Notz, Michael A. Fligner
Publisher:W. H. Freeman
Introduction to the Practice of Statistics
Statistics
ISBN:9781319013387
Author:David S. Moore, George P. McCabe, Bruce A. Craig
Publisher:W. H. Freeman