
A First Course in Probability (10th Edition)
10th Edition
ISBN: 9780134753119
Author: Sheldon Ross
Publisher: PEARSON
expand_more
expand_more
format_list_bulleted
Related questions
Question
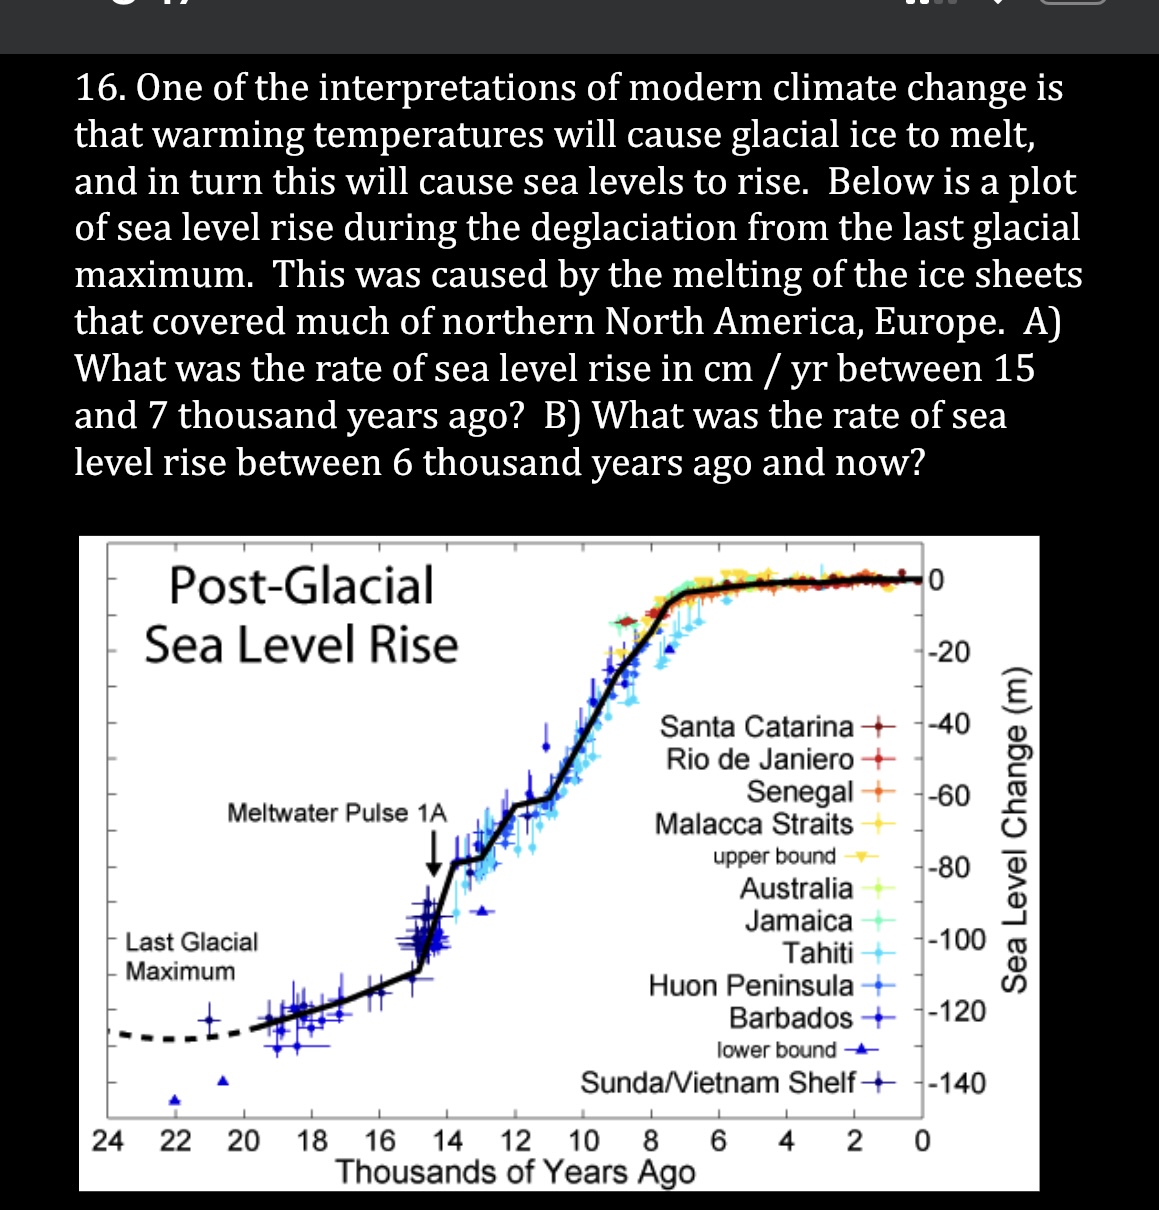

Transcribed Image Text:16. One of the interpretations of modern climate change is
that warming temperatures will cause glacial ice to melt,
and in turn this will cause sea levels to rise. Below is a plot
of sea level rise during the deglaciation from the last glacial
maximum. This was caused by the melting of the ice sheets
that covered much of northern North America, Europe. A)
What was the rate of sea level rise in cm / yr between 15
and 7 thousand years ago? B) What was the rate of sea
level rise between 6 thousand years ago and now?
0
Post-Glacial
Sea Level Rise
-20
Santa Catarina + --40
Rio de Janiero +
Senegal -60
Meltwater Pulse 1A
Malacca Straits
upper bound
-80
Australia
Jamaica
-100
Tahiti
Huon Peninsula →
Barbados
-120
lower bound
Sunda/Vietnam Shelf
-140
↓
1
1
20 18 16 14 12 10 8 6 4 2 0
Thousands of Years Ago
Last Glacial
Maximum
24 22
Sea Level Change (m)
Expert Solution
This question has been solved!
Explore an expertly crafted, step-by-step solution for a thorough understanding of key concepts.

Step by stepSolved in 3 steps

Knowledge Booster

Similar questions
- Page 33 of 33 Previous Next 33) The population of a city duplicates in 16 years. What is the approximate rate of growth? a) O 4.3% b) O 6.9% с) О 3.0% d) O 14.4%arrow_forward10. Suppose a stone is dropped from the observation deck of the Space Needle in Seattle, 160 meters above the ground. How long will it take for the stone to hit the ground? (You will need to know that the acceleration of gravity is a = -9.8 meters per second?.)arrow_forwardThe temp of water “T” in degrees Celsius after being heated for “t” seconds is illustrated by the graph below. a) What is the average rate of change in water temperature from 30 to 80 seconds. Illustrate on graph b) Estimate the instantaneous rate of change in water temperature at 80 seconds. Illustrate on graph make sure to illustrate both parts on the same one grapharrow_forward
arrow_back_ios
arrow_forward_ios
Recommended textbooks for you
- A First Course in Probability (10th Edition)ProbabilityISBN:9780134753119Author:Sheldon RossPublisher:PEARSON

A First Course in Probability (10th Edition)
Probability
ISBN:9780134753119
Author:Sheldon Ross
Publisher:PEARSON