MATLAB: An Introduction with Applications
6th Edition
ISBN: 9781119256830
Author: Amos Gilat
Publisher: John Wiley & Sons Inc
expand_more
expand_more
format_list_bulleted
Topic Video
Question

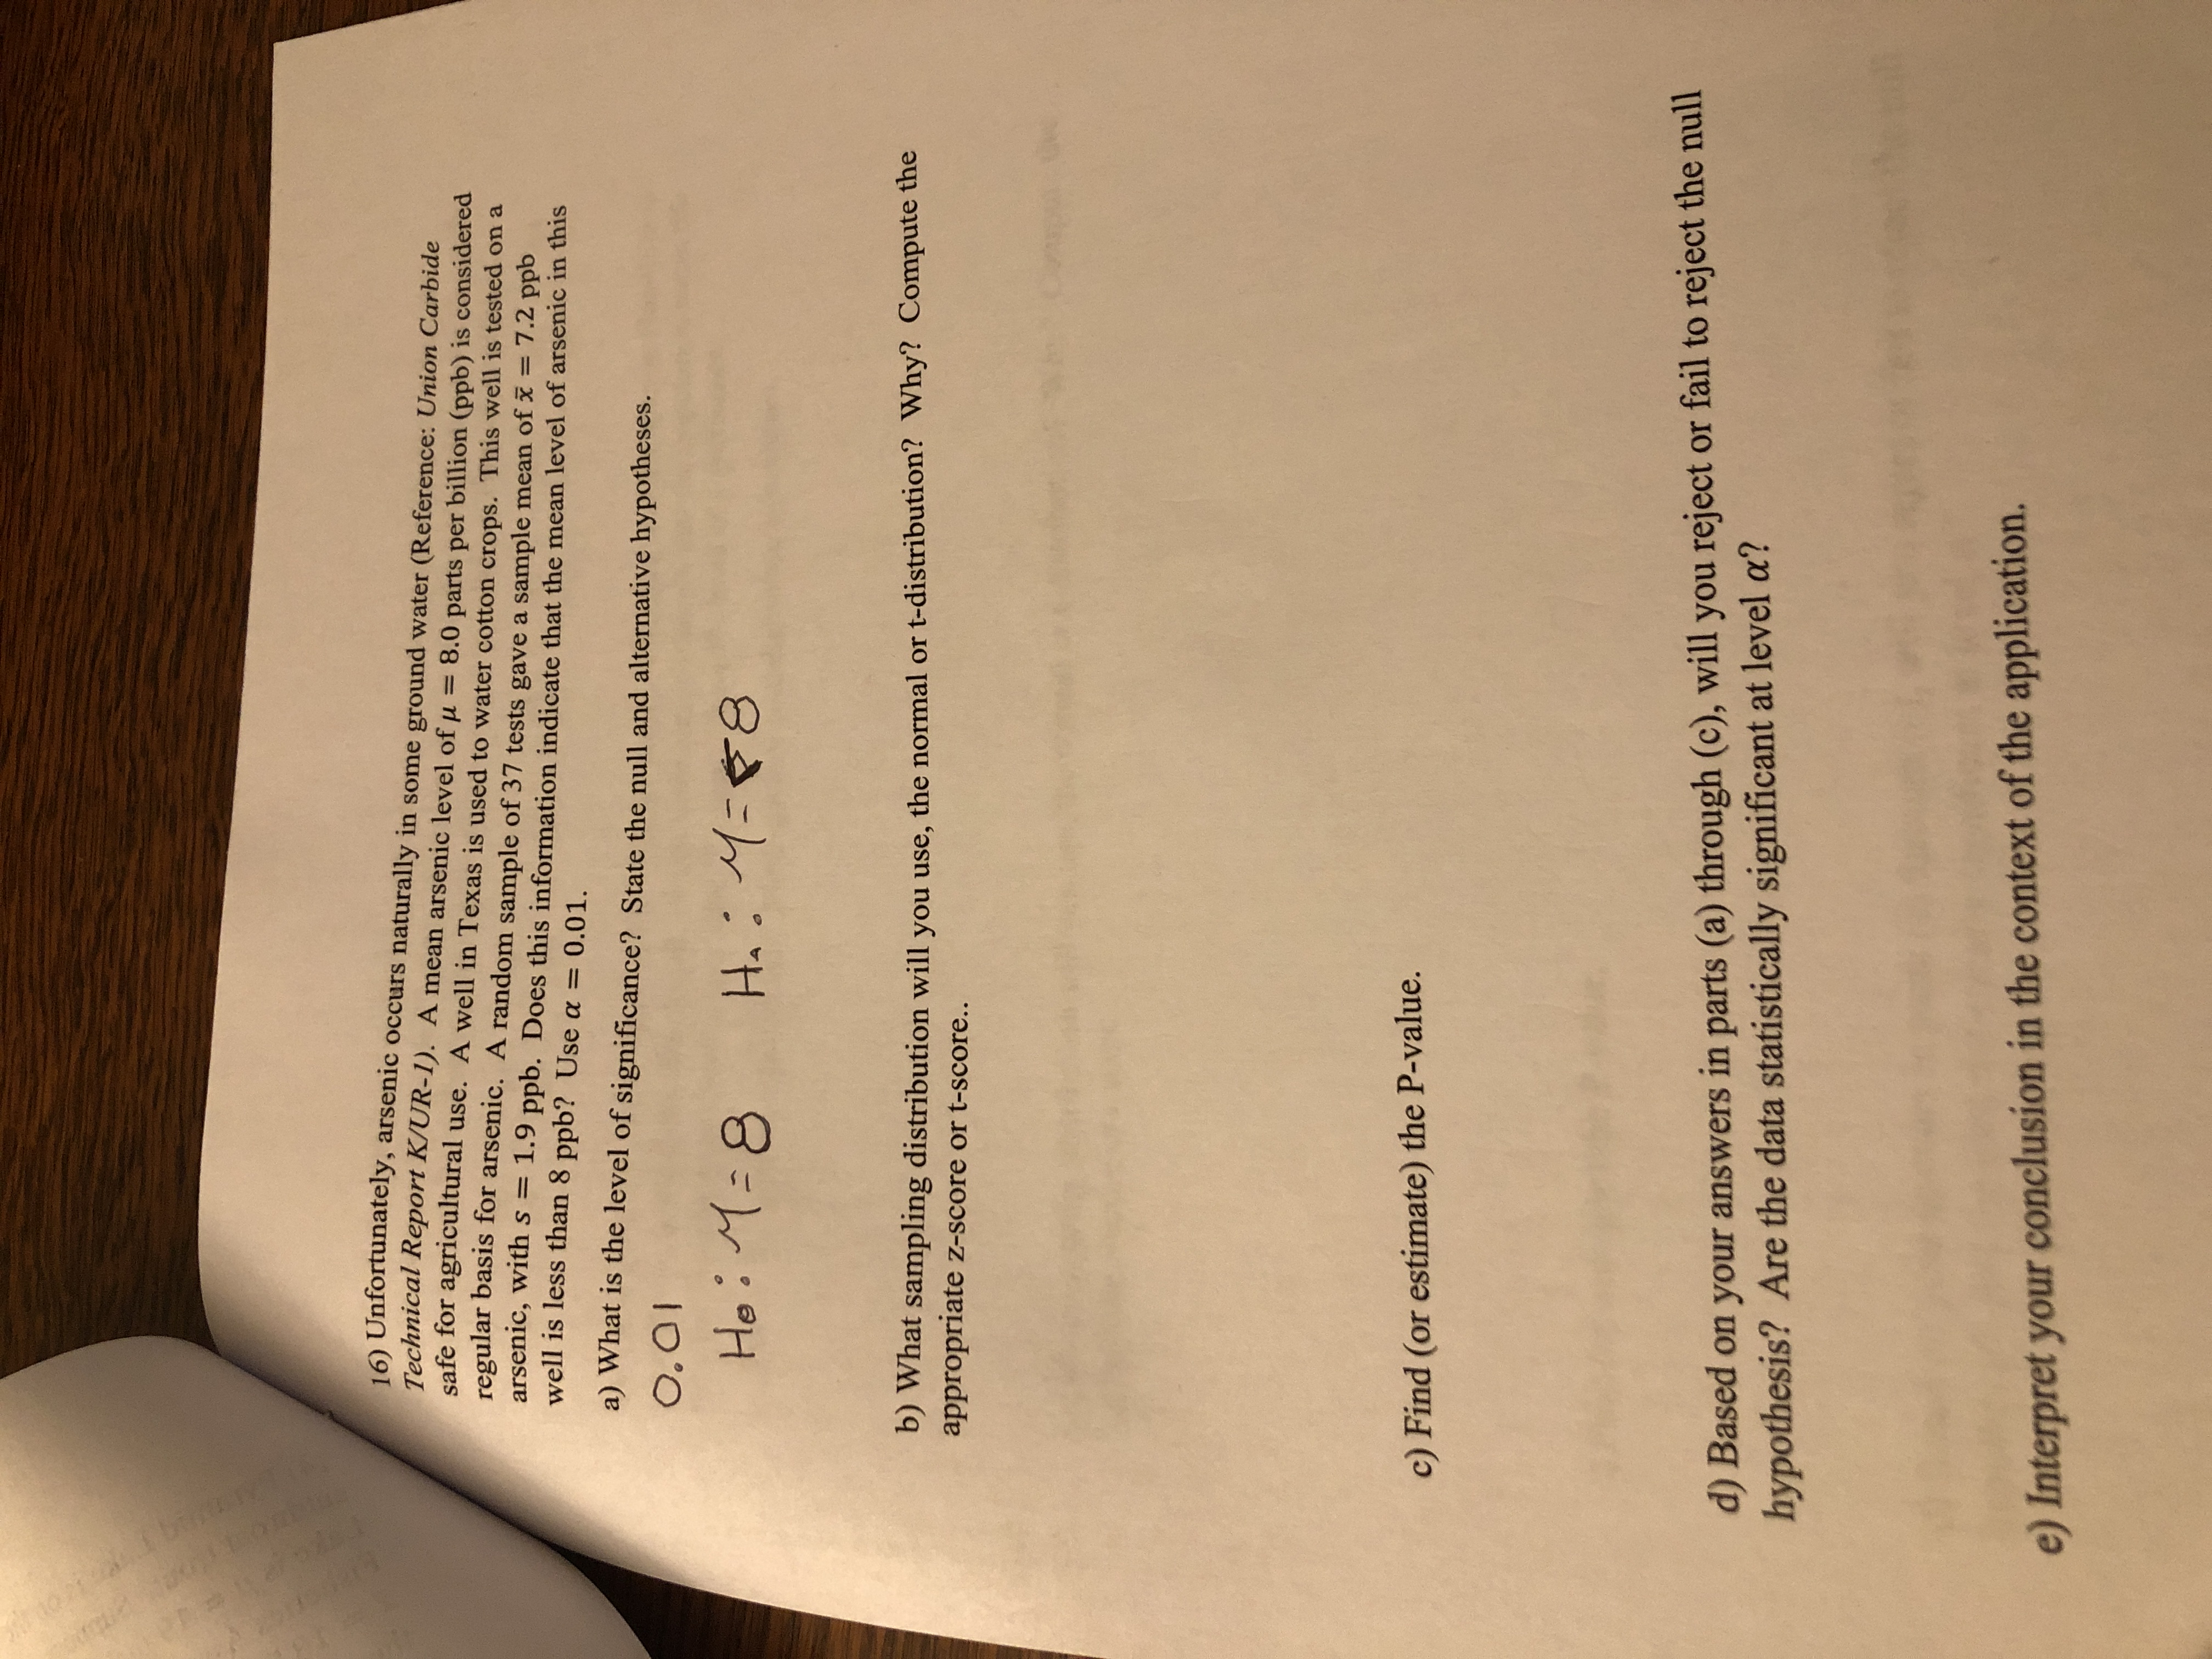
Transcribed Image Text:### Statistical Analysis of Arsenic Levels in Ground Water
**Problem Statement:**
Arsenic naturally occurs in some groundwater sources. According to the *Union Carbide Technical Report (K/UR-1)*, a mean arsenic level of \( \mu = 8.0 \) parts per billion (ppb) is considered safe for agricultural use. A well in Texas, regularly used to water cotton crops, is being tested for arsenic. A random sample of 37 tests shows a sample mean of \( \bar{x} = 7.2 \) ppb, with a standard deviation \( s = 1.9 \) ppb.
#### Objective:
To determine if the mean level of arsenic in this well is less than 8 ppb using a significance level of \( \alpha = 0.01 \).
### Hypothesis Testing
**a) Level of Significance:**
- The significance level is \( \alpha = 0.01 \).
**Null and Alternative Hypotheses:**
- Null Hypothesis (\( H_0 \)): \( \mu = 8 \)
- Alternative Hypothesis (\( H_a \)): \( \mu < 8 \)
**b) Sampling Distribution:**
- Determine whether to use the normal or t-distribution and compute the appropriate z-score or t-score.
**c) P-value:**
- Compute or estimate the P-value based on the data collected.
**d) Decision Rule:**
- Based on the findings from parts (a) through (c), decide whether to reject or fail to reject the null hypothesis. Assess if the data are statistically significant at \( \alpha = 0.01 \).
**e) Conclusion:**
- Interpret the conclusion in the context of groundwater safety for agricultural purposes.
This exercise involves using statistical tools to analyze the safety of groundwater for agricultural use and to make informed decisions based on data.
Expert Solution
This question has been solved!
Explore an expertly crafted, step-by-step solution for a thorough understanding of key concepts.
This is a popular solution
Trending nowThis is a popular solution!
Step by stepSolved in 4 steps

Knowledge Booster
Learn more about
Need a deep-dive on the concept behind this application? Look no further. Learn more about this topic, statistics and related others by exploring similar questions and additional content below.Similar questions
- 17. please state all 6 steps of the p method clearly please! Strength of concrete: The compressive strength, in kilopascals, was measured for concrete blocks from five different batches of concrete, both three and six days after pouring. The data are as follows. Can you conclude that the mean strength after three days differs from the mean strength after six days? Let μ1 represent the mean strength after three days and =μd−μ1μ2 . Use the =α0.05 level and the P -value method with the TI-84 Plus calculator. Block 1 2 3 4 5 After 3 days 1371 1379 1344 1383 1386 After 6 days 1328 1337 1344 1321 1345arrow_forward10. An engineering study was undertaken to determine the optimum thickness of aluminum to be used to construct cans to be used for cat food. Cans made of aluminum of thickness 2.10 mm and 1.90 mm were tested to determine the maximum load each would sustain before collapsing. The sample data is summarized below. Use a = 0.05 to test the claim that the thicker cans are stronger (will withstand a higher load). 2.10 mm thick 1.90 mm thick sample size 175 170 mean maximum load (kg) 28.18 26.71 standard deviation of maximum load (kg) | 2.78 2.21arrow_forwardusing the z table (table e), find the critical value (or values) for each. a. alpha=0.10, two tailed test b. alpha=0.01, right tailed test c. aplha=0.005, left tailed testarrow_forward
- Calculate the Chi-square following instructions either in Excel or Google sheetsarrow_forwardCase scenario: A cohort study involved an assessment of the relationship between cigarette smoking and incuof lung cancer. For cigarette smokers, the lung cancer incidence rate was Iexp = 200 per 100,000. For nonsmokers, the lung cancer incidence rate was Iunexp = 25 per 100,000. The lung cancer incidence rate in the entire population was Itotal = 100 per 100,000. A) what is the relative risk (risk ratio) of developing lung cancer? Interpret this value in plain language? B) calculate the attributable risk and interpret this value in plain language? C) calculate the attributable-risk percent and interpret this value in plain language? D) is cigarette smoking a risk factor for lung cancer? Explain your answer. E) Hypothetically speaking, if cigarette smoking could be eliminated from this population, what percentage of lung cancer could be avoided?arrow_forward
arrow_back_ios
arrow_forward_ios
Recommended textbooks for you
 MATLAB: An Introduction with ApplicationsStatisticsISBN:9781119256830Author:Amos GilatPublisher:John Wiley & Sons Inc
 Probability and Statistics for Engineering and th...StatisticsISBN:9781305251809Author:Jay L. DevorePublisher:Cengage Learning
 Statistics for The Behavioral Sciences (MindTap C...StatisticsISBN:9781305504912Author:Frederick J Gravetter, Larry B. WallnauPublisher:Cengage Learning
 Elementary Statistics: Picturing the World (7th E...StatisticsISBN:9780134683416Author:Ron Larson, Betsy FarberPublisher:PEARSON
 The Basic Practice of StatisticsStatisticsISBN:9781319042578Author:David S. Moore, William I. Notz, Michael A. FlignerPublisher:W. H. Freeman
 Introduction to the Practice of StatisticsStatisticsISBN:9781319013387Author:David S. Moore, George P. McCabe, Bruce A. CraigPublisher:W. H. Freeman

MATLAB: An Introduction with Applications
Statistics
ISBN:9781119256830
Author:Amos Gilat
Publisher:John Wiley & Sons Inc

Probability and Statistics for Engineering and th...
Statistics
ISBN:9781305251809
Author:Jay L. Devore
Publisher:Cengage Learning

Statistics for The Behavioral Sciences (MindTap C...
Statistics
ISBN:9781305504912
Author:Frederick J Gravetter, Larry B. Wallnau
Publisher:Cengage Learning

Elementary Statistics: Picturing the World (7th E...
Statistics
ISBN:9780134683416
Author:Ron Larson, Betsy Farber
Publisher:PEARSON

The Basic Practice of Statistics
Statistics
ISBN:9781319042578
Author:David S. Moore, William I. Notz, Michael A. Fligner
Publisher:W. H. Freeman

Introduction to the Practice of Statistics
Statistics
ISBN:9781319013387
Author:David S. Moore, George P. McCabe, Bruce A. Craig
Publisher:W. H. Freeman