Advanced Engineering Mathematics
10th Edition
ISBN: 9780470458365
Author: Erwin Kreyszig
Publisher: Wiley, John & Sons, Incorporated
expand_more
expand_more
format_list_bulleted
Question

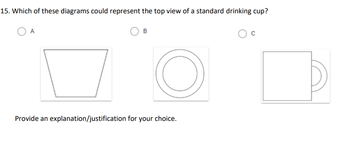
Transcribed Image Text:15. Which of these diagrams could represent the top view of a standard drinking cup?
A
B
Provide an explanation/justification for your choice.
Expert Solution
This question has been solved!
Explore an expertly crafted, step-by-step solution for a thorough understanding of key concepts.
Step by stepSolved in 2 steps

Knowledge Booster
Similar questions
- 5. See pictures to solvearrow_forwardThe book The Wall Street Journal. Guide to Information Graphics by Dona M. Wong gives strategies for using graphs and charts to display information effectively. One popular graph discussed is the donut pie chart. The donut pie chart is simply a pie chart with the center removed. A recent Harris Poll asked adults about their opinions regarding whether books should be banned from libraries because of social, language, violent, sexual, or religious content. The responses by education level to the question "Do you think that there are any books which should be banned completely?" are shown in the following donut pie charts. (a) What feature of Keith's graph makes it difficult to visually compare the responses of those with some college to those shown in the other graphs? (Select all that apply.) a)The graphs made by Keith and Ramon compare groups across education level. b)The graphs made by Keith and Ramon are all donut pie charts. c)The graphs do not have data labels showing the…arrow_forward8 Here we are talking about quality control and the control charts depends variable or attribute . THE TITLE IS ... GYMS .... WE NEED THIS CHARACTERSTICS ( 3 THINGS ENOUGH ) NOTE ; TALKING ABOUT .... GYMS .... Define the quality characteristics and identify whether they are variable or attribute. Explain in detail how they are related to the quality of the product/servicearrow_forward
- A report from Texas Transportation Institute (Texas A&M University System, 2005) titled "Congestion Reduction Strategies" included the following data on extra travel time during rush hour for very large and for large urban areas. 2.27 Very Large Urban Areas Extra Hours per Year per Traveler Los Angeles, CA 93 San Francisco, CA 72 Washington DC-VA-MD 69 Atlanta. GA 67 Houston. TX 63 Dallas, Fort Worth, TX 60 Chicago, IL-IN 58 Detroit, MI 57 Miami, FL 51 Boston, MA-NH-RI 51 New York, NY-NJ-CT 49 Phoenix, AZ 49 Philadelphia, PA-NJ-DE-MD 38 Extra Hours per Year Large Urban Areas per Traveler Riverside, CA 55 Orlando, FL 55 San Jose, CA 53 San Diego, CA Denver, CO 52 51 Baltimore, MD 50 Seattle, WA 46 Tampa, FL Minneapolis, St Paul, MN Sacramento, CA Portland, OR-WA 46 43 40 39 Indianapolis, IN St Louis, MO-IL 38 35 San Antonio, TX 33 Providence, RI-MA 33 Las Vegas, NV Cincinnati, OH-KY-IN 30 30 Columbus, OH 29 Virginia Beach, VA Milwaukee, WI New Orleans, LA 26 23 18 Kansas City, MO-KS 17…arrow_forwardQ4. What is the true interpretation for R Square? A) 49% of the correlation of GDP per capita explains by independent variables. B) 49% of the correlation of independent variables can explain by GDP per capita. C) 49% of the variation of GDP per capita explains by independent variables. D) 49% of the auto-correlation of independent variables can explain by GDP per capita.arrow_forward4. A doctor notices that in cities where more people get flu shots, the number of cases of flu decreases. This would be an example of: Group of answer choices A positive relationship A strong relationship A negative relationship A weak relationshiparrow_forward
- khanacademy.org + 88 A Whole Class... A USATestpre... IL IXL | Consta... M Inbox (63) -... Study Guide... Gët Busy [Of... b Homework H... * Systems of... X Mathway | Al.. G how to take... < 8th grade Unit: Systems of equations Systems of equations with graphing 180 / 7 Mastery po Find the solution to the system of equations. You can use the interactive graph below to find the solution. Skill Sum y = -2x + 7 Intro to sys y = 5x – 7 %3D Systems of y = Solving sys 5 4 3 2 Quiz 1: 5 q Practice wh + + up on the a -7 -6 -5 -4 -3 -2 1 2 3 4 5 6 7 -2 Number of -3 equations -5- -6· Systems of Stuck? Review related articles/videos oor use a hint Unit test Test your k Denort a nroblem skills in this Get 3 of 4 questions to level up to Familiar Check Systems of equations with substitution: ihatitu: నాarrow_forwardcomplete sentences) 1. A high school guidance counselor analyzed data from a sample of 300 community colleges throughout the United States. One of his goals was to estimate the annual tuition costs of community colleges in the United States. Describe the population and variable of interest to the guidance counselor (also explain the definitions).arrow_forwardHelparrow_forward
arrow_back_ios
arrow_forward_ios
Recommended textbooks for you
 Advanced Engineering MathematicsAdvanced MathISBN:9780470458365Author:Erwin KreyszigPublisher:Wiley, John & Sons, Incorporated
 Numerical Methods for EngineersAdvanced MathISBN:9780073397924Author:Steven C. Chapra Dr., Raymond P. CanalePublisher:McGraw-Hill Education
 Introductory Mathematics for Engineering Applicat...Advanced MathISBN:9781118141809Author:Nathan KlingbeilPublisher:WILEY
 Mathematics For Machine TechnologyAdvanced MathISBN:9781337798310Author:Peterson, John.Publisher:Cengage Learning,


Advanced Engineering Mathematics
Advanced Math
ISBN:9780470458365
Author:Erwin Kreyszig
Publisher:Wiley, John & Sons, Incorporated

Numerical Methods for Engineers
Advanced Math
ISBN:9780073397924
Author:Steven C. Chapra Dr., Raymond P. Canale
Publisher:McGraw-Hill Education

Introductory Mathematics for Engineering Applicat...
Advanced Math
ISBN:9781118141809
Author:Nathan Klingbeil
Publisher:WILEY

Mathematics For Machine Technology
Advanced Math
ISBN:9781337798310
Author:Peterson, John.
Publisher:Cengage Learning,

