MATLAB: An Introduction with Applications
6th Edition
ISBN: 9781119256830
Author: Amos Gilat
Publisher: John Wiley & Sons Inc
expand_more
expand_more
format_list_bulleted
Concept explainers
Question
thumb_up100%
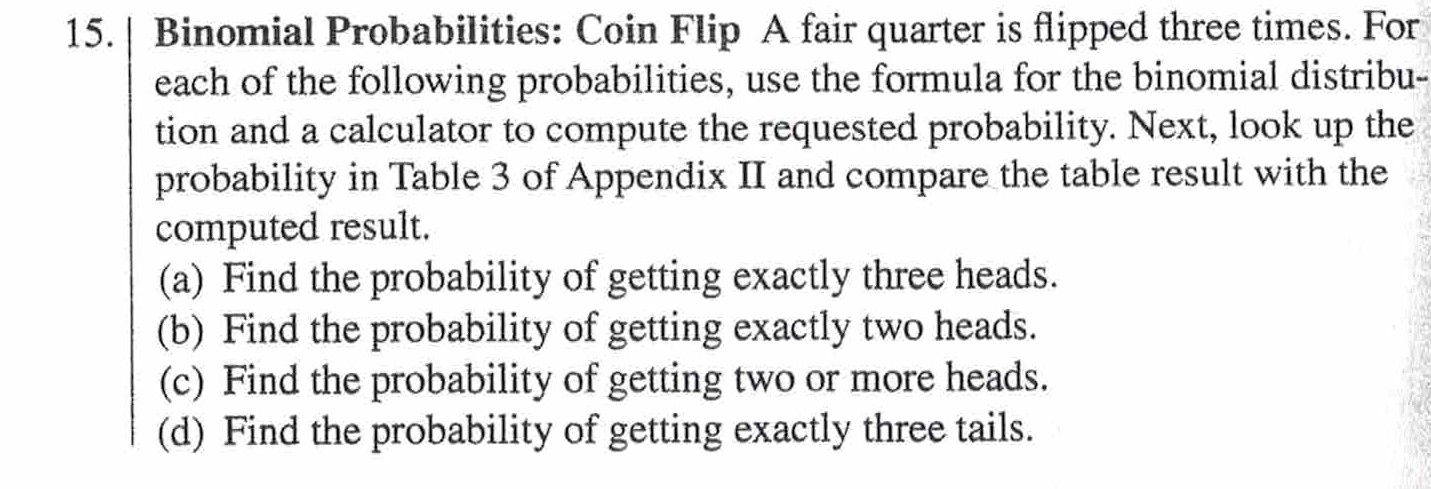
Please help solve (step by step) part #15d. Thank you! Also, please note book reference Table 3 Appendix II is from ISBN: 978133727104-2 "Understandable Statistics: Concepts and Methods," (12th ed.), Brase and Brase: Cengage.

Transcribed Image Text:15. | Binomial Probabilities: Coin Flip A fair quarter is flipped three times. For
each of the following probabilities, use the formula for the binomial distribu-
tion and a calculator to compute the requested probability. Next, look up the
probability in Table 3 of Appendix II and compare the table result with the
computed result.
(a) Find the probability of getting exactly three heads.
(b) Find the probability of getting exactly two heads.
(c) Find the probability of getting two or more heads.
(d) Find the probability of getting exactly three tails.
Expert Solution
This question has been solved!
Explore an expertly crafted, step-by-step solution for a thorough understanding of key concepts.
This is a popular solution
Trending nowThis is a popular solution!
Step by stepSolved in 6 steps with 6 images

Knowledge Booster
Learn more about
Need a deep-dive on the concept behind this application? Look no further. Learn more about this topic, statistics and related others by exploring similar questions and additional content below.Similar questions
- Can you help me with this page pleasearrow_forwardPlease do not give solution in image formate thanku The textbook suggests 20-25% of the data used for forecasting should be used as the hold-out sample. Why might you want to use significantly more or significantly less data as your hold-out? What considerations go into determining hold-out length?arrow_forward[Statistics] Use R or RStudio Context of the problem:Fire damage in the United States amounts to billions of dollars, much of it insured. The time taken to arrive at the fire is critical. This raises the question, Should insurance companies lower premiums if the home to be insured is close to a fire station? To help make a decision, a study was undertaken wherein a number of fires were investigated. The distance to the nearest fire station (in miles) and the percentage of fire damage were recorded. Here is the data set: Distance Percent7.5 688.3 666.2 341.6 305.6 706 624.3 478.1 725.7 400.3 531.6 182.5 485.8 535.3 486.3 643.4 526.2 613.2 346.3 656.1 664.6 336.7 760.5 343.2 465.3 555 334.8 466.4 490.2 174.9 476.2 637.6 696.6 542.9 522.1 434.8 358.1 581.2 54.6 464 576.1 400.8 395.9 426.5 626.5 527.5 767.2 676.7 454.1 234 334.8 594…arrow_forward
- carefully weigh the data before casting your vote. As you review the data, you ask yourself, Assuming both teams handled roughly the same number of customers, which chart impresses me more? Which team is the most consistent? Which team, over time, has better average scores? Growing scores? Declining scores? What does the Descriptive Statistics ToolPak tell me about the data? Which team is showing improvement? Can I estimate (or visually predict using the best fit line) which team will have better future performance? If so, which team? How do I know? …and, for whom should I vote?arrow_forwardplease send correct answerarrow_forwardNull? test statistics? p value? conclusion for hypothesisarrow_forward
- Can I get help with this question? https://www.bartleby.com/solution-answer/chapter-4-problem-24p-statistics-for-the-behavioral-sciences-mindtap-course-list-10th-edition/9781305504912/f105f4ca-5a7b-11e9-8385-02ee952b546earrow_forwardetermine whether the data are qualitative or quantitative and determine the level of mea- surement. Explain your reasoning. (a) The years in which the LA Lakers won the NBA championship (for example, 2020). ¥Circle one: Quantitative Qualitative ¥Level of measurement: ¥Explain your reasoning: (b) A collection of zip codes. ¥Circle one: Quantitative Qualitative ¥Level of measurement: ¥Explain your reasoning: (c) Today’s temperature in degrees Fahrenheit. ¥Circle one: Quantitative Qualitative ¥Level of measurement: ¥Explain your reasoning:arrow_forwardIntroductory Statistics 3rd edition - 8.34 p-values For each graph, state whether the shaded area could represent a p-value. Explain why or why not. If yes, state whether the area could represent the p-value for a one-sided or a two-sided alternative hypothesis. (images are the graphs)arrow_forward
arrow_back_ios
arrow_forward_ios
Recommended textbooks for you
 MATLAB: An Introduction with ApplicationsStatisticsISBN:9781119256830Author:Amos GilatPublisher:John Wiley & Sons Inc
 Probability and Statistics for Engineering and th...StatisticsISBN:9781305251809Author:Jay L. DevorePublisher:Cengage Learning
 Statistics for The Behavioral Sciences (MindTap C...StatisticsISBN:9781305504912Author:Frederick J Gravetter, Larry B. WallnauPublisher:Cengage Learning
 Elementary Statistics: Picturing the World (7th E...StatisticsISBN:9780134683416Author:Ron Larson, Betsy FarberPublisher:PEARSON
 The Basic Practice of StatisticsStatisticsISBN:9781319042578Author:David S. Moore, William I. Notz, Michael A. FlignerPublisher:W. H. Freeman
 Introduction to the Practice of StatisticsStatisticsISBN:9781319013387Author:David S. Moore, George P. McCabe, Bruce A. CraigPublisher:W. H. Freeman

MATLAB: An Introduction with Applications
Statistics
ISBN:9781119256830
Author:Amos Gilat
Publisher:John Wiley & Sons Inc

Probability and Statistics for Engineering and th...
Statistics
ISBN:9781305251809
Author:Jay L. Devore
Publisher:Cengage Learning

Statistics for The Behavioral Sciences (MindTap C...
Statistics
ISBN:9781305504912
Author:Frederick J Gravetter, Larry B. Wallnau
Publisher:Cengage Learning

Elementary Statistics: Picturing the World (7th E...
Statistics
ISBN:9780134683416
Author:Ron Larson, Betsy Farber
Publisher:PEARSON

The Basic Practice of Statistics
Statistics
ISBN:9781319042578
Author:David S. Moore, William I. Notz, Michael A. Fligner
Publisher:W. H. Freeman

Introduction to the Practice of Statistics
Statistics
ISBN:9781319013387
Author:David S. Moore, George P. McCabe, Bruce A. Craig
Publisher:W. H. Freeman