
Glencoe Algebra 1, Student Edition, 9780079039897, 0079039898, 2018
18th Edition
ISBN: 9780079039897
Author: Carter
Publisher: McGraw Hill
expand_more
expand_more
format_list_bulleted
Related questions
Question
thumb_up100%
Show calculations please
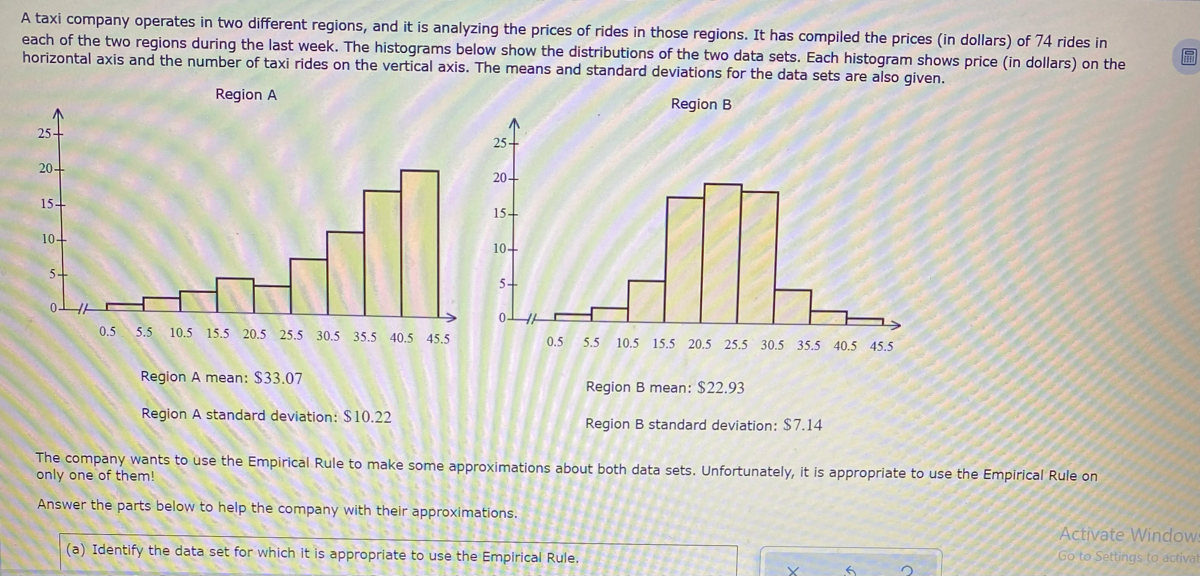

Transcribed Image Text:A taxi company operates in two different regions, and it is analyzing the prices of rides in those regions. It has compiled the prices (in dollars) of 74 rides in
each of the two regions during the last week. The histograms below show the distributions of the two data sets. Each histogram shows price (in dollars) on the
horizontal axis and the number of taxi rides on the vertical axis. The means and standard deviations for the data sets are also given.
Region A
Region B
25-
25+
20-
20-
15-
15-
10-
10-
5-
5-
0.5
5.5 10.5 15,5 20.5 25.5 30.5 35.5 40.5
45.5
0.5 5.5 10.5 15.5 20.5 25.5 30.5 35.5 40.5 45.5
Region A mean: $33.07
Region B mean: $22.93
Region A standard deviation: $10.22
Region B standard deviation: $7.14
The company wants to use the Empirical Rule to make some approximations about both data sets. Unfortunately, it is appropriate to use the Empirical Rule on
only one of them!
Answer the parts below to help the company with their approximations.
Activate Window
Go to Settings to activat
(a) Identify the data set for which it is appropriate to use the Empirical Rule.

Transcribed Image Text:15-
15-
10-
10-
5-
5-
0-
0.5
5.5
10.5 15.5 20.5 25.5 30.5 35.5 40.5 45,5
0.5
5.5
10.5 15.5 20.5 25.5 30.5 35.5 40.5 45.5
Region A mean: $33.07
Region B mean: $22.93
Region A standard deviation: $10.22
Region B standard deviation: $7.14
The company wants to use the Empirical Rule to make some approximations about both data sets. Unfortunately, it is appropriate to use the Empirical Rule on
only one of them!
Answer the parts below to help the company with their approximations.
(a) Identify the data set for which it is appropriate to use the Empirical Rule.
It is appropriate to use the Empirical Rule for the (Choose one) v data set.
For the data set identified in part (a), use the Empirical Rule to make the following approximations.
(b) The percentage of rides costing between $8.65 and $37.21 is approximately (Choose one)
(c) Approximately 68% of the rides cost between $ and S.
Expert Solution
This question has been solved!
Explore an expertly crafted, step-by-step solution for a thorough understanding of key concepts.

Step by stepSolved in 2 steps with 1 images

Knowledge Booster

Recommended textbooks for you
- Glencoe Algebra 1, Student Edition, 9780079039897...AlgebraISBN:9780079039897Author:CarterPublisher:McGraw Hill
 Big Ideas Math A Bridge To Success Algebra 1: Stu...AlgebraISBN:9781680331141Author:HOUGHTON MIFFLIN HARCOURTPublisher:Houghton Mifflin Harcourt
 Holt Mcdougal Larson Pre-algebra: Student Edition...AlgebraISBN:9780547587776Author:HOLT MCDOUGALPublisher:HOLT MCDOUGAL
Glencoe Algebra 1, Student Edition, 9780079039897...
Algebra
ISBN:9780079039897
Author:Carter
Publisher:McGraw Hill
Big Ideas Math A Bridge To Success Algebra 1: Stu...
Algebra
ISBN:9781680331141
Author:HOUGHTON MIFFLIN HARCOURT
Publisher:Houghton Mifflin Harcourt
Holt Mcdougal Larson Pre-algebra: Student Edition...
Algebra
ISBN:9780547587776
Author:HOLT MCDOUGAL
Publisher:HOLT MCDOUGAL