14. How did you make the determination in Question #13?
Q: A golf association requires that golf balls have a diameter that is 1.68 inches. To determine if…
A: Given Mean=1.68 n=12
Q: In a TSLS estimation, O A. stage 1 is the structural model. B. stage 2 is used to remove the…
A: Two-Stage least squares (TSLS) regression analysis is used in the analysis of structural equations.…
Q: What is the conclusion about the null hypothesis? O A. Fail to reject the null hypothesis because…
A:
Q: Graph distributions of point sums by throwing a perfect die up to 30 times and test each case with…
A: When throwing a perfect die is 1/6. p=1/6 For n=5 tosses: Normal distributionμ,σ=Nnp, np(1-p)…
Q: 3. What is your alternative hypothesis? (in statistical notation)
A: Given that Number of participant= 7
Q: Find the range for the group of data items. 2, 2, 4, 4, 6
A: Data given 2, 2, 4, 4, 6
Q: Use this set of data to answer questions #1 - #17. You are conducting a correlational study.…
A: From the provided information, Participant X Y XY X2 Y2 A 2 4…
Q: the following table summarizes the outcome of a study that researchers carried out to determine if…
A: Men Women expressed fear of heights…
Q: 4. What is your alternative hypothesis? (in word:
A: We have to determine the alternative hypothesis for correlation between x and y.
Q: The probability that a car will arrive at its destination is uniformly distributed from 30 minutes…
A: here given, car will arrive at its destination is uniformly distributed from 30 minute to 50 minute…
Q: 2. If {X(t); te T} be a time series then for any t1, t2 define the autocovariance function (t1,t2) =…
A: Given Information: Xt:t∈T be a time series for any t1 and t2.
Q: In 1992, the Journal of Epidemiology and Community Health published an article that claimed that the…
A: Let X be the random variable from Normal distribution with mean (μ) = 6.6, standard deviation (σ) =…
Q: 5. Consider an estimator for o? as follows: S'2 = - n. A. Show that S'2 is a biased estimator for…
A:
Q: 1. A small study aims to see the correlation between having a tattoo and cases of clinical…
A: Here AS PER NOTE GIVEN I HAVE CALCULATED Q1
Q: IV. The Math Club in MB School, Inc. is composed of 4 freshmen, 6 sophomores, 5 juniors and 2…
A: Let us suppose there are three marbles viz. a red, a green and a blue. From these, there are three…
Q: An existing inventory for a test measuring self-esteem indicates that the scores have a standard…
A:
Q: Answer the following questions about probability and statistics. A. What is P(X = 5) when X ~…
A: Given that. X~N( 5 ,25 ) X~N( 0 , 1 ) μ=0 , ?=1 (for standard normal distribution)…
Q: On the basis of her newly developed technique, a student believes she can reduce the amount of time…
A:
Q: You are selling a merchandise to customers whose valuations for the product are distributed by the…
A:
Q: Find the median for the following group of data items. 35, 32, 31, 30, 36, 33, 29, 31
A: Given values 35, 32, 31, 30, 36, 33, 29, 31 By using online calculator
Q: Determine the point estimate of the population proportion, the margin of error for the following…
A:
Q: 49. If a set of X and Y scores has a Pearson correlation ofr= 0.50, 50% of the variability in Y…
A: We have given the statement about the Pearson correlation.
Q: 23. If you are doing a two-tailed test and alpha = .05, find the critical value of r from the table:
A: Correlation is an associational statistic.
Q: 16. If the Pearson Correlation Coefficient that you calculated in #9 remains the same, but you had 4…
A: Using the given data ( 16 ) Make the decision
Q: We know that the wage distribution in the US is not normally distributed. It is closer to a pareto…
A: Given that, We randomly sample (n) 1286 high school students in California. The sample average is…
Q: IELTS mock examination for many years. Below is the summary presented by the tutorial school related…
A:
Q: You want to obtain a sample to estimate a population proportion. Based on previous evidence, you…
A:
Q: What is the population parameter? Pick What is the point estimate for the population proportion? p =…
A: We have given that Favourable cases(Hispanic/Latino), X = 68 Sample size, n = 400 Confidence level…
Q: sample size is large, it does'nt matter what shape the distribution of the population it was drawn…
A: It is to be known about the central limit theorem is that When the sample size is large i.e. n is…
Q: (3) Players 1 and 2 are bargaining over how to split $1. Each player simultaneously and…
A:
Q: Consider the following estimated regression with a sample of size n=50. AHE = -2.44 – 1.57 » DFemale…
A: While fitting a linear regression model, one of the most important assumption is the the variance of…
Q: 17. How did you make the determination in Question #16?
A: Correlation coefficient is a measure of statistical association between continuous variables.
Q: Thanks to an initiative to recruit top students, an administrator at a college claims that this…
A: According to the given information in this question We need to apply t test for one population…
Q: (a) Fit a simple linear regression model with y green liquor Na2S concentration and x production.…
A: A).
Q: 10% of all Americans live in poverty. If 47 Americans are randomly selected, find the probability…
A: Let X be the random variable from binomial distribution with probability (p) = 10% = 0.10 and sample…
Q: It is desired to obtain a 95% confidence interval for the mean time µ= 120 minutes to take the…
A:
Q: A sociologist claims that the students’ college GPA’s in unrelated to their families’ incomes. For a…
A: It is given that Sample size n = 20 Correlation coefficient r = 0.40 Level of significance = 0.01
Q: It is commonly believed that the mean body temperature of a healthy adult is 98.6^\circ F. You are…
A: Given Population mean μ=98.6. Data given 92.9,71.4,93,90.8,88,99.1,83.1,78.1,84.1,90.8,97.7,97.7
Q: 1. John, Paul, and George can finish a job in 12, 16, and 19 hours respectively. John and Paul…
A: "Since you have asked multiple questions, we will solve the first question for you. If you want any…
Q: Suppose the average US salary is $41,000. If a sample of 50 people are randomly surveyed then there…
A: Given Average=41000
Q: What are the null and alternative hypotheses? b) Determine the test statistic. c) Determine the…
A: Given that Hypothesized Population Mean (\mu)(μ) = 00 Sample Standard Deviation (s)(s) =…
Q: Random samples of 210 are taken from a population where p = 181. 39 25% of all sample means were…
A:
Q: A sociologist plans to conduct a survey to estimate the percentage of healthcare professionals who…
A: From the provided information, Confidence level = 92% Margin of error = 3%
Q: Question 3 A study was conducted to determine the differences in the average weight loss of four…
A: Given Information: Consider the given data that shows the average weight loss of four groups of…
Q: QUESTION 3 (a) 70% of students sitting a Statistics examination will complete it before the…
A:
Q: Is there a relationship between the number of votes received by candidates for public office and the…
A: From the provided information, Sample size (n) = 4 Candidate Amount spent (000) Votes…
Q: A new industrial oven has just been installed at Piatt Bakery. To develop experience regarding the…
A: Control chart are used to measure the observation or lot is in control or out of control. If the…
Q: For the same data set above, if we set our alpha .01, find the critical r from the table:
A: It is given that Number of observations n = 15 SSx = 4, SSy = 25 and SP = 6
Q: 22. How many degrees of freedom (df) are in this study?
A: Given that n=6 There are 6 observation
Q: Mutually Exclusive or NOT 1. GIVEN: Amelia has a deck of 52 cards. She randomly selects one card and…
A: If the two events cannot occur at the same time then the two events are called as mutually exclusive…
JUST QUESTION 14 PLEASE
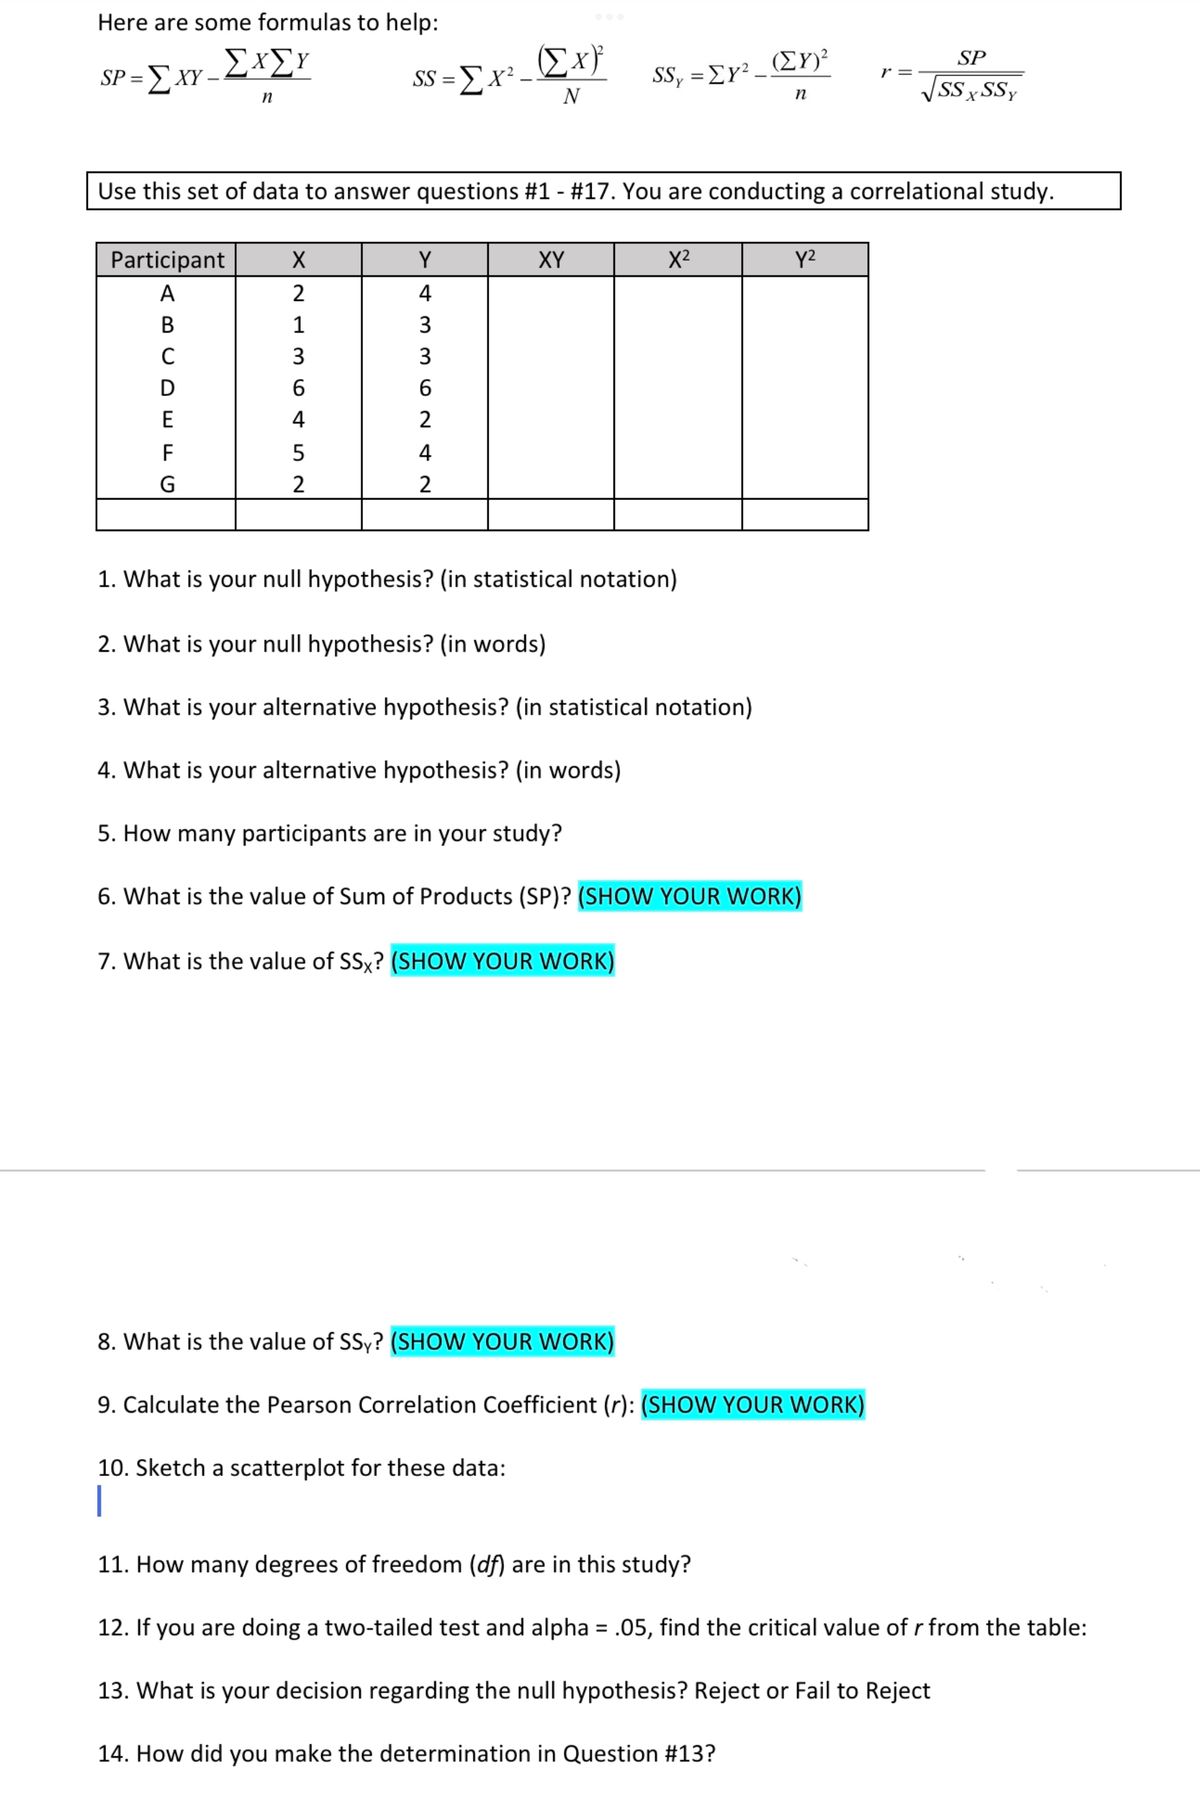
Step by step
Solved in 2 steps with 2 images
- Respiratory Rate Researchers have found that the 95 th percentile the value at which 95% of the data are at or below for respiratory rates in breath per minute during the first 3 years of infancy are given by y=101.82411-0.0125995x+0.00013401x2 for awake infants and y=101.72858-0.0139928x+0.00017646x2 for sleeping infants, where x is the age in months. Source: Pediatrics. a. What is the domain for each function? b. For each respiratory rate, is the rate decreasing or increasing over the first 3 years of life? Hint: Is the graph of the quadratic in the exponent opening upward or downward? Where is the vertex? c. Verify your answer to part b using a graphing calculator. d. For a 1- year-old infant in the 95 th percentile, how much higher is the walking respiratory rate then the sleeping respiratory rate? e. f.If your graphing calculator is capable of computing a least-squares sinusoidal regression model, use it to find a second model for the data. Graph this new equation along with your first model. How do they compare?In a partially destroyed laboratory, record of an analysis of correlation, data, the following results only are legible:Variance of X=9. Regression equation: 8X –10Y + 66=0, 40X–18Y = 214.(1) the mean value X and Y,(2) the correlation coefficient between X and Y, and (3) the standard deviation of Y ?
- Cou run a regression analysis on a bivariate set of data (n = obtain the regression equation 39). With 24.8 and = 43.4, you y = 2.058z - 27.113 with a correlation coefficient of r = 0.251. You want to predict what value (on average) for the response variable will be obtained from a value of 180 as the explanatory variable. What is the predicted response value? y = 343.3 (Report answer accurate to one decimal place.)Suppose that you run a correlation and find the correlation coefficient is -0.256 and the regression equation is ˆy=−5.8x+56.92 . The means of your data were x=6.9 and y=17.4If the critical value is .606, use the appropriate method to predict the y value when x is 5.4For the data below, the Pearson correlation coefficient between y and x^2 isA. 0.913B. 0.985C. 0.990D. 0.873
- Two variable are found to have a strong positive linear correlation. Pick the regression equation that best fits this scenario. y = -0.34x + 25 y = 0.84x25 Oy = -0.84x + 25 Oŷ = 0.34x - 25In the regression modelY = β0 + β1X1 + β2X2 + εthe extent of any multi collinearity can be evaluated by finding the correlation between X1 and X2 in the sample. Explain why this is so.Exercise 2 Age B.P |(x) Age B.P (y) (y) |(x) 20 120 46 128 The following are the age (in years) and systolic blood pressure of 20 apparently healthy adults. 43 128 53 136 63 141 60 146 26 126 20 124 53 134 63 143 31 128 43 130 58 136 26 124 46 132 19 121 58 140 31 126 70 144 23 123
- If two regression coefficients bxy = 0.72 and byx = 0.55, Find the correlation coefficient (r) ? Round to 3 decimals.Two variables have the regression lines 3x + 2y = 26 and 6x + y = 31. Find the mean values, the correlation coefficient between x and y and the ratio of variances of the variables.A correlation of r=1.2 is not possible? Define?