ENGR.ECONOMIC ANALYSIS
14th Edition
ISBN: 9780190931919
Author: NEWNAN
Publisher: Oxford University Press
expand_more
expand_more
format_list_bulleted
Question
The task I am struggling with.
Thank you very much for your help and have a nice day.

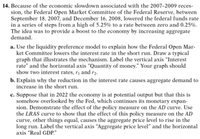
Transcribed Image Text:14. Because of the economic slowdown associated with the 2007–2009 reces-
sion, the Federal Open Market Committee of the Federal Reserve, between
September 18, 2007, and December 16, 2008, lowered the federal funds rate
in a series of steps from a high of 5.25% to a rate between zero and 0.25%.
The idea was to provide a boost to the economy by increasing aggregate
demand.
a. Use the liquidity preference model to explain how the Federal Open Mar-
ket Committee lowers the interest rate in the short run. Draw a typical
graph that illustrates the mechanism. Label the vertical axis "Interest
rate" and the horizontal axis “Quantity of money." Your graph should
show two interest rates, r¡ and r2.
b. Explain why the reduction in the interest rate causes aggregate demand to
increase in the short run.
c. Suppose that in 2022 the economy is at potential output but that this is
somehow overlooked by the Fed, which continues its monetary expan-
sion. Demonstrate the effect of the policy measure on the AD curve. Use
the LRAS curve to show that the effect of this policy measure on the AD
curve, other things equal, causes the aggregate price level to rise in the
long run. Label the vertical axis “Aggregate price level" and the horizontal
axis "Real GDP."
Expert Solution
This question has been solved!
Explore an expertly crafted, step-by-step solution for a thorough understanding of key concepts.
This is a popular solution
Trending nowThis is a popular solution!
Step by stepSolved in 5 steps with 3 images

Knowledge Booster
Learn more about
Need a deep-dive on the concept behind this application? Look no further. Learn more about this topic, economics and related others by exploring similar questions and additional content below.Similar questions
arrow_back_ios
arrow_forward_ios
Recommended textbooks for you

 Principles of Economics (12th Edition)EconomicsISBN:9780134078779Author:Karl E. Case, Ray C. Fair, Sharon E. OsterPublisher:PEARSON
 Engineering Economy (17th Edition)EconomicsISBN:9780134870069Author:William G. Sullivan, Elin M. Wicks, C. Patrick KoellingPublisher:PEARSON
 Principles of Economics (MindTap Course List)EconomicsISBN:9781305585126Author:N. Gregory MankiwPublisher:Cengage Learning
 Managerial Economics: A Problem Solving ApproachEconomicsISBN:9781337106665Author:Luke M. Froeb, Brian T. McCann, Michael R. Ward, Mike ShorPublisher:Cengage Learning
 Managerial Economics & Business Strategy (Mcgraw-...EconomicsISBN:9781259290619Author:Michael Baye, Jeff PrincePublisher:McGraw-Hill Education


Principles of Economics (12th Edition)
Economics
ISBN:9780134078779
Author:Karl E. Case, Ray C. Fair, Sharon E. Oster
Publisher:PEARSON

Engineering Economy (17th Edition)
Economics
ISBN:9780134870069
Author:William G. Sullivan, Elin M. Wicks, C. Patrick Koelling
Publisher:PEARSON

Principles of Economics (MindTap Course List)
Economics
ISBN:9781305585126
Author:N. Gregory Mankiw
Publisher:Cengage Learning

Managerial Economics: A Problem Solving Approach
Economics
ISBN:9781337106665
Author:Luke M. Froeb, Brian T. McCann, Michael R. Ward, Mike Shor
Publisher:Cengage Learning

Managerial Economics & Business Strategy (Mcgraw-...
Economics
ISBN:9781259290619
Author:Michael Baye, Jeff Prince
Publisher:McGraw-Hill Education