Calculus: Early Transcendentals
8th Edition
ISBN: 9781285741550
Author: James Stewart
Publisher: Cengage Learning
expand_more
expand_more
format_list_bulleted
Question

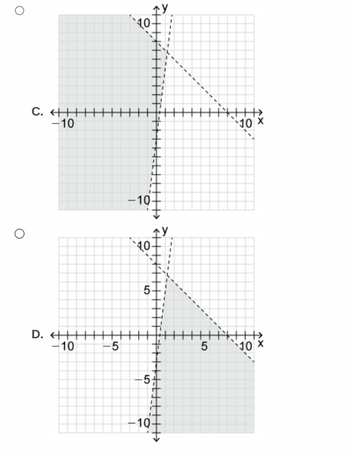
Transcribed Image Text:The image features two coordinate plane graphs labeled C and D. Each graph contains a system of inequalities represented by dashed lines, along with shaded regions indicating the solution sets.
### Graph C:
- **Axes**: The x-axis and y-axis both extend from -10 to 10.
- **Lines**:
- The first line runs diagonally from the top left to the bottom right. This line intersects the y-axis at approximately -7 and the x-axis at approximately 7.
- The second line is a curve that appears to be parabolic, opening upwards and intersecting the x-axis close to the origin, curving towards the right.
- **Shading**: The area to the left of the parabolic curve, above the diagonal line, is shaded in gray. This indicates the solution region for the system of inequalities.
### Graph D:
- **Axes**: The x-axis and y-axis both extend from -10 to 10.
- **Lines**:
- The first line is similar to the diagonal line in Graph C, running from top left to bottom right, intersecting the y-axis and x-axis at around the same coordinates as Graph C.
- The second line is another upward-opening curve, intersecting the y-axis above the x-axis and curving towards the right.
- **Shading**: The area to the right of the parabolic curve, below the diagonal line, is shaded in gray, representing the solution region for this system of inequalities.
Both graphs demonstrate how different inequalities can define distinct solution regions on the coordinate plane.

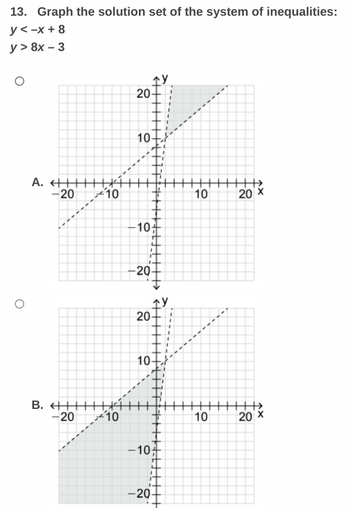
Transcribed Image Text:**Graph the Solution Set of the System of Inequalities:**
**Problem:**
13. Graph the solution set of the system of inequalities:
\( y < -x + 8 \)
\( y > 8x - 3 \)
**Graph A Description:**
- The graph shows a coordinate plane with a shaded region.
- The line \( y = -x + 8 \) is represented as a dashed line with a negative slope, starting at the y-intercept (0, 8).
- The area above this line is unshaded, while the area below the line is not highlighted, indicating that solutions do not satisfy the inequality \( y < -x + 8 \).
**Graph B Description:**
- The graph displays another coordinate plane with a different shaded region.
- The line \( y = 8x - 3 \) is represented as a dashed line with a positive slope, starting at the y-intercept (0, -3).
- The area below this line is not shaded, while the area above the line is shaded, indicating that solutions satisfy the inequality \( y > 8x - 3 \).
In conclusion, the correct graph should show the overlapping region where both inequalities are satisfied, meaning where one shaded region overlaps with the other.
Expert Solution
arrow_forward
Step 1
Topic- System of inequalities
We are given ,y<-x+8
y>8x-3
in slope intercept form ,
y=mx+c
m=slope of line
c=y intercept
Step by stepSolved in 2 steps

Knowledge Booster
Similar questions
- Graph the feasible region for the given system of inequalities. x+ 2y ≤ 8 2x+y ≤ 8 X>0 y 20 Use the graphing tool on the right to graph the system of inequalities. Click to enlarge graph -to 10 8 6 -6 18arrow_forwardD Graph the solution of the system of inequalities. y z0 8xt2y <16 3X+5y<15 i) Graph the solntion set to ysc? -4 Graph the inegalitiesarrow_forward19.) Question is attached!arrow_forward
- Which system of inequalities represents the graph? O y ≤ 3x + 2 and y> -2x + 3 Oy≤ x + 6 and y 3x + 2 Oys-x+6 and y > 2x + 3 Oy> -2x + 4 and y ≤ 4x - 3arrow_forward3. Jack and Jill work at the same store. Jack's total weekly salary, in dollars, if he sells x items is given by S= = 100 + 5x, and Jill's total weekly salary, in dollars, if she sells x items is given by S = 80 + 6x. If they sell the same number of items in a week, what is the minimum number of items they have to sell so that Jill's weekly salary is at least $300 more than Jack's? Verarrow_forward
arrow_back_ios
arrow_forward_ios
Recommended textbooks for you
 Calculus: Early TranscendentalsCalculusISBN:9781285741550Author:James StewartPublisher:Cengage Learning
 Thomas' Calculus (14th Edition)CalculusISBN:9780134438986Author:Joel R. Hass, Christopher E. Heil, Maurice D. WeirPublisher:PEARSON
 Calculus: Early Transcendentals (3rd Edition)CalculusISBN:9780134763644Author:William L. Briggs, Lyle Cochran, Bernard Gillett, Eric SchulzPublisher:PEARSON
 Calculus: Early TranscendentalsCalculusISBN:9781319050740Author:Jon Rogawski, Colin Adams, Robert FranzosaPublisher:W. H. Freeman
 Calculus: Early Transcendental FunctionsCalculusISBN:9781337552516Author:Ron Larson, Bruce H. EdwardsPublisher:Cengage Learning

Calculus: Early Transcendentals
Calculus
ISBN:9781285741550
Author:James Stewart
Publisher:Cengage Learning

Thomas' Calculus (14th Edition)
Calculus
ISBN:9780134438986
Author:Joel R. Hass, Christopher E. Heil, Maurice D. Weir
Publisher:PEARSON

Calculus: Early Transcendentals (3rd Edition)
Calculus
ISBN:9780134763644
Author:William L. Briggs, Lyle Cochran, Bernard Gillett, Eric Schulz
Publisher:PEARSON

Calculus: Early Transcendentals
Calculus
ISBN:9781319050740
Author:Jon Rogawski, Colin Adams, Robert Franzosa
Publisher:W. H. Freeman


Calculus: Early Transcendental Functions
Calculus
ISBN:9781337552516
Author:Ron Larson, Bruce H. Edwards
Publisher:Cengage Learning