
A First Course in Probability (10th Edition)
10th Edition
ISBN: 9780134753119
Author: Sheldon Ross
Publisher: PEARSON
expand_more
expand_more
format_list_bulleted
Related questions
Concept explainers
Question
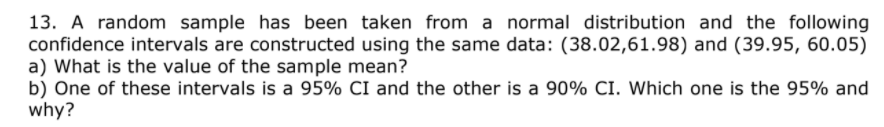

Transcribed Image Text:13. A random sample has been taken from a normal distribution and the following
confidence intervals are constructed using the same data: (38.02,61.98) and (39.95, 60.05)
a) What is the value of the sample mean?
b) One of these intervals is a 95% CI and the other is a 90% CI. Which one is the 95% and
why?
Expert Solution
This question has been solved!
Explore an expertly crafted, step-by-step solution for a thorough understanding of key concepts.

This is a popular solution

Trending nowThis is a popular solution!

Step by stepSolved in 3 steps with 2 images

Knowledge Booster


Learn more about
Need a deep-dive on the concept behind this application? Look no further. Learn more about this topic, probability and related others by exploring similar questions and additional content below.Similar questions
- Professor Nord stated that the mean score on the final exam from all the years he has been teaching is a 79%. Colby was in his most recent class, and his class’s mean score on the final exam was 82%. Colby decided to run a hypothesis test to determine if the mean score of his class was significantly greater than the mean score of the population. α = .01. What is the mean score of the population? What is the mean score of the sample? Is this test one-tailed or two-tailed? Why?arrow_forward3a) The mean IQ of 200 patients in a psychiatric hospital is 91, with a variance of 16, and the distribution is highly negatively skewed. Between what two IQ scores would we expect to find at least 160 of the patients falling? b) If the distribution was mound-shaped and symmetrical, with the same mean and standard deviation as in part A, approximately how many patients would have IQ scores at or below the 5th percentile or above a score of 97? Answers: a) 82 to 100 b) 28.5 or 29arrow_forwardThe weekly expenditure on groceries of a random sample of 100 family households was recorded. It was estimated that the mean expenditure was approximately $240. With rising interest rates and petrol prices, it was anticipated that grocery expenditure might decrease. Which hypothesis test would you use to test this claim? 1.One tailed, one sample t-test 2.Two tailed, one sample t-test 3.One tailed, z-test 4.One-tailed Paired Samples t-test 5.Chi Squarearrow_forward
- Q4. Identify the incorrect statement below: The estimator, X from a random sample of X A. Is the mean of the population of X. B. Is an unbiased estimator of the population mean. C. Has an expected value equal to the mean of X. D. Is a random variable with a variance smaller than the variance of X. O A. A ОВ. В С. С O D. Darrow_forwardI. There are two samples with means 15 and 18. Both of those samples consist of 24 observations. Sample standard deviations are equal to 4 in both cases. If you want to test whether the difference between the mean in the first and the mean in the second population is equal to 0, what is your decision at the .01 level?arrow_forward14.arrow_forward
- Which type of confidence interval should you use in this situation? A sample of 25 different payroll departments found that the employees worked an average of 310.3 days a year with a standard deviation of 23.8 days. The distribution is approximately normally distributed. Find the 90% confidence interval for the average days worked of all payroll departments. Question 2 options: 1) a confidence interval for the mean using a table value from the standard normal distribution. 2) a confidence interval for the mean using a table value from the t distribution. 3) a confidence interval for a proportion using a table value from the standard normal distribution. 4) a confidence interval for proportion using a table value from the t distribution. 5) none of the above.arrow_forward9 The standard error of the mean is, a 0.881 b 0.735 c 0.612 d 0.510arrow_forwardanswer d)arrow_forward
arrow_back_ios
arrow_forward_ios
Recommended textbooks for you
- A First Course in Probability (10th Edition)ProbabilityISBN:9780134753119Author:Sheldon RossPublisher:PEARSON

A First Course in Probability (10th Edition)
Probability
ISBN:9780134753119
Author:Sheldon Ross
Publisher:PEARSON