ENGR.ECONOMIC ANALYSIS
14th Edition
ISBN: 9780190931919
Author: NEWNAN
Publisher: Oxford University Press
expand_more
expand_more
format_list_bulleted
Question
Nn2

Transcribed Image Text:-0.13
ces
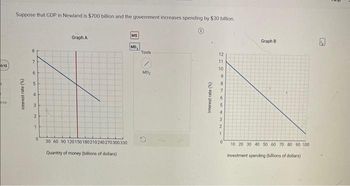
Suppose that GDP in Newland is $700 billion and the government increases spending by $30 billion.
0
Interest rate (%)
8
7
6
5
ST
3
2
1
0
Graph A
30 60 90 120150180210240270300330
Quantity of money (billions of dollars)
MS
MD,
Tools
MD₂
Interest rate (%)
210
11
10
9
8
7
6
5
3
2
1
0
Graph B
10 20 30 40 50 60 70 80 90 100
Investment spending (billions of dollars)
S

Transcribed Image Text:a. If the multiplier equals 5, what is the new level of GDP?
$
billion
b. Suppose that as a result of the increase in GDP the price level in Newland also rises, causing the demand for money to increase by
$90 billion. Show the new money demand, labelled MD2, in graph A above. Plot only the endpoints of the curve above.
c. What will be the new interest rate?
d. In graph B, by how much will investment spending change?
$
billion.
e. Given the same value of the multiplier, what will be the new level of GDP?
billion
Expert Solution
This question has been solved!
Explore an expertly crafted, step-by-step solution for a thorough understanding of key concepts.
Step by stepSolved in 7 steps with 1 images

Knowledge Booster
Learn more about
Need a deep-dive on the concept behind this application? Look no further. Learn more about this topic, economics and related others by exploring similar questions and additional content below.Similar questions
- 3.12 and 3.16arrow_forwardStudy: 30-Year Life Expectancy Gap in 2 Chicago Communities The life expectancy of people living in an affluent community on Chicago's North Side is decades more than people living in a poor African American community on the city's South Side, according to a new study. A New York University School of Medicine analysis reveals that on average, Streeterville residents live to be 90 years old, the Chicago Tribune reported. The typical life expectancy of residents of Englewood, about 9 miles to the south, is roughly 60 years. NYU researchers said the 30-year divide between the two neighborhoods is the nation's largest disparity. The academics studied life expectancies in neighborhoods in America's 500 largest cities based on information from the Centers for Disease Control and Prevention from 2010 to 2015. Mayor Lori Lightfoot has vowed to improve schools, generate jobs and nurture economic development on struggling neighborhoods in Chicago's West and South Side communities. The study…arrow_forwardSuppose that education does not affect worker’s productivity, but it is more costly for low-ability workers to obtain the education. If firms cannot distinguish between different workers they must pay them all the wage equal to the expected productivity. If they can distinguish between workers with different abilities, they pay each worker their marginal product of labour and make zero profits. 70% of workers in the population have low ability. The productivity of low-ability workers is YL = 20000, and the productivity of high-ability workers is YH = 50000. The cost of education to high-ability workers is CH(S) = S 4 , and the cost of education to low-ability workers is CL = S. (Answer 4.5.6 only) 1. Suppose firms cannot observe worker’s education. What wage will they offer to a highability worker? What is the optimal level of schooling for the high-ability worker? Why? 2. Suppose that firms can observe worker’s educational attainment and believe that workers with the level of…arrow_forward
- Please I need answer to botharrow_forwardThe accompanying table lists the incomes of five citizens of a hypothetical economy. Suppose the government introduces a new program for low-wage carners. Under this program, cach citizen is given a refund that is paid for with tax revenues and is equal to a percentage of the citizen's income. The chart shows applicable income brackets and the percentage to be refunded. Citizen Income ($) Income Range ($) Income Supplement (% of Original) Frankie 27000.00 0-17,000 40% Vinnie 33000.00 17,001-36,000 25% Artie 15000.00 36,001-52,000 10% Nicky 62000.00 52,001 and above 0% Jackie 25000.00 What is the amount of Frankie's refund? What is the amount of Artie's refund? What is the amount of Nicky's refund? Which of the following is a problematic feature of a welfare state that is mitigated by the supplement's gradual decline? the implicit marginal tax inflation a revenue shortfall recessionarrow_forwardclai)= A.Q, claz) = Bq A CA, B,a,P) ail positive Q = Dp> all positivearrow_forward
- Welfare and Efficiency - End of Chapter Problem A study by University of Minnesota economist, Joel Waldfogel, estimated the difference in the actual monetary value of gifts received and how much the recipients would have been willing to pay to buy them on their own. The study suggested that the average recipient's valuation was approximately 90% of the actual purchase price. a. In 2019, it was estimated that the average amount spent on winter holiday gifts in Canada was $692. Based on the estimate from the Waldfogel study, how much of this would be deadweight loss? Enter your answer to the cent. b. In 2019, approximately 30 million people in Canada above the age of 18. Assuming that each individual purchased $692 worth of gifts, what was the total deadweight loss associated with gift giving in Canada? Round your answer to the nearest million dollars. millionarrow_forwardA cottage industry exists in the home-manufacture of ‘country crafts’. Especially treasured are handmade quilts. If the fourth completed quilt took 30 hours to make, and the eighth quilt took 28 hours. What is the percentage learning? Hint: Percentage learning = 100% - (c2/c1)•100%arrow_forwardA group of 10 people have the following annual incomes: $55,000, $30,000, $15,000, $20,000, $35,000, $80,000, $40,000, $45,000, $30,000, $50,000. Complete the table. Income Quintile Share of Income $15,000 Bottom $20,000 $30,000 2nd $30,000 $35,000 3rd $40,000 $45,000 4th $50,000 $55,000 Top $80,000 If $4000 is taxed from the top earner and transferred to the lowest earner, would that increase or decrease the share of income held by the top quintile? Would this transfer increase or decrease the share of income held by the bottom quintile? Would this have any effect on the 2nd quintile? The 3rd? The 4th? Would this transfer increase, decrease, or have no effect on income inequality in this group? Redistributing income from the highest earner to the lowest one would reduce the utility of the top earner and increase the utility of the lowest earner. But what would happen to the overall utility of the…arrow_forward
- at job group(Occupation) was the smallest among immigrants? Why do you think so few people from that group came to the United States?2.) What job group was the largest? Why do you think so many people from that group came to the United States?arrow_forward12arrow_forwardConsider the following table with individuals in a country and their incomes: Individuals Income 1 15 30 4 45 55 6 70 7 85 8. 100 115 10 130 Total 650 O The ratio of income received by the top decile to the bottom quintile is 3.5. O The ratio of income received by the top decile to the bottom quintile is 7.3. O The ratio of income received by the top decile to the bottom quintile is 4.3. O The ratio of income received by the top decile to the bottom quintile is 6.5.arrow_forward
arrow_back_ios
SEE MORE QUESTIONS
arrow_forward_ios
Recommended textbooks for you

 Principles of Economics (12th Edition)EconomicsISBN:9780134078779Author:Karl E. Case, Ray C. Fair, Sharon E. OsterPublisher:PEARSON
 Engineering Economy (17th Edition)EconomicsISBN:9780134870069Author:William G. Sullivan, Elin M. Wicks, C. Patrick KoellingPublisher:PEARSON
 Principles of Economics (MindTap Course List)EconomicsISBN:9781305585126Author:N. Gregory MankiwPublisher:Cengage Learning
 Managerial Economics: A Problem Solving ApproachEconomicsISBN:9781337106665Author:Luke M. Froeb, Brian T. McCann, Michael R. Ward, Mike ShorPublisher:Cengage Learning
 Managerial Economics & Business Strategy (Mcgraw-...EconomicsISBN:9781259290619Author:Michael Baye, Jeff PrincePublisher:McGraw-Hill Education


Principles of Economics (12th Edition)
Economics
ISBN:9780134078779
Author:Karl E. Case, Ray C. Fair, Sharon E. Oster
Publisher:PEARSON

Engineering Economy (17th Edition)
Economics
ISBN:9780134870069
Author:William G. Sullivan, Elin M. Wicks, C. Patrick Koelling
Publisher:PEARSON

Principles of Economics (MindTap Course List)
Economics
ISBN:9781305585126
Author:N. Gregory Mankiw
Publisher:Cengage Learning

Managerial Economics: A Problem Solving Approach
Economics
ISBN:9781337106665
Author:Luke M. Froeb, Brian T. McCann, Michael R. Ward, Mike Shor
Publisher:Cengage Learning

Managerial Economics & Business Strategy (Mcgraw-...
Economics
ISBN:9781259290619
Author:Michael Baye, Jeff Prince
Publisher:McGraw-Hill Education