
MATLAB: An Introduction with Applications
6th Edition
ISBN: 9781119256830
Author: Amos Gilat
Publisher: John Wiley & Sons Inc
expand_more
expand_more
format_list_bulleted
Related questions
Concept explainers
Topic Video
Question
Number 100 A, B, and C
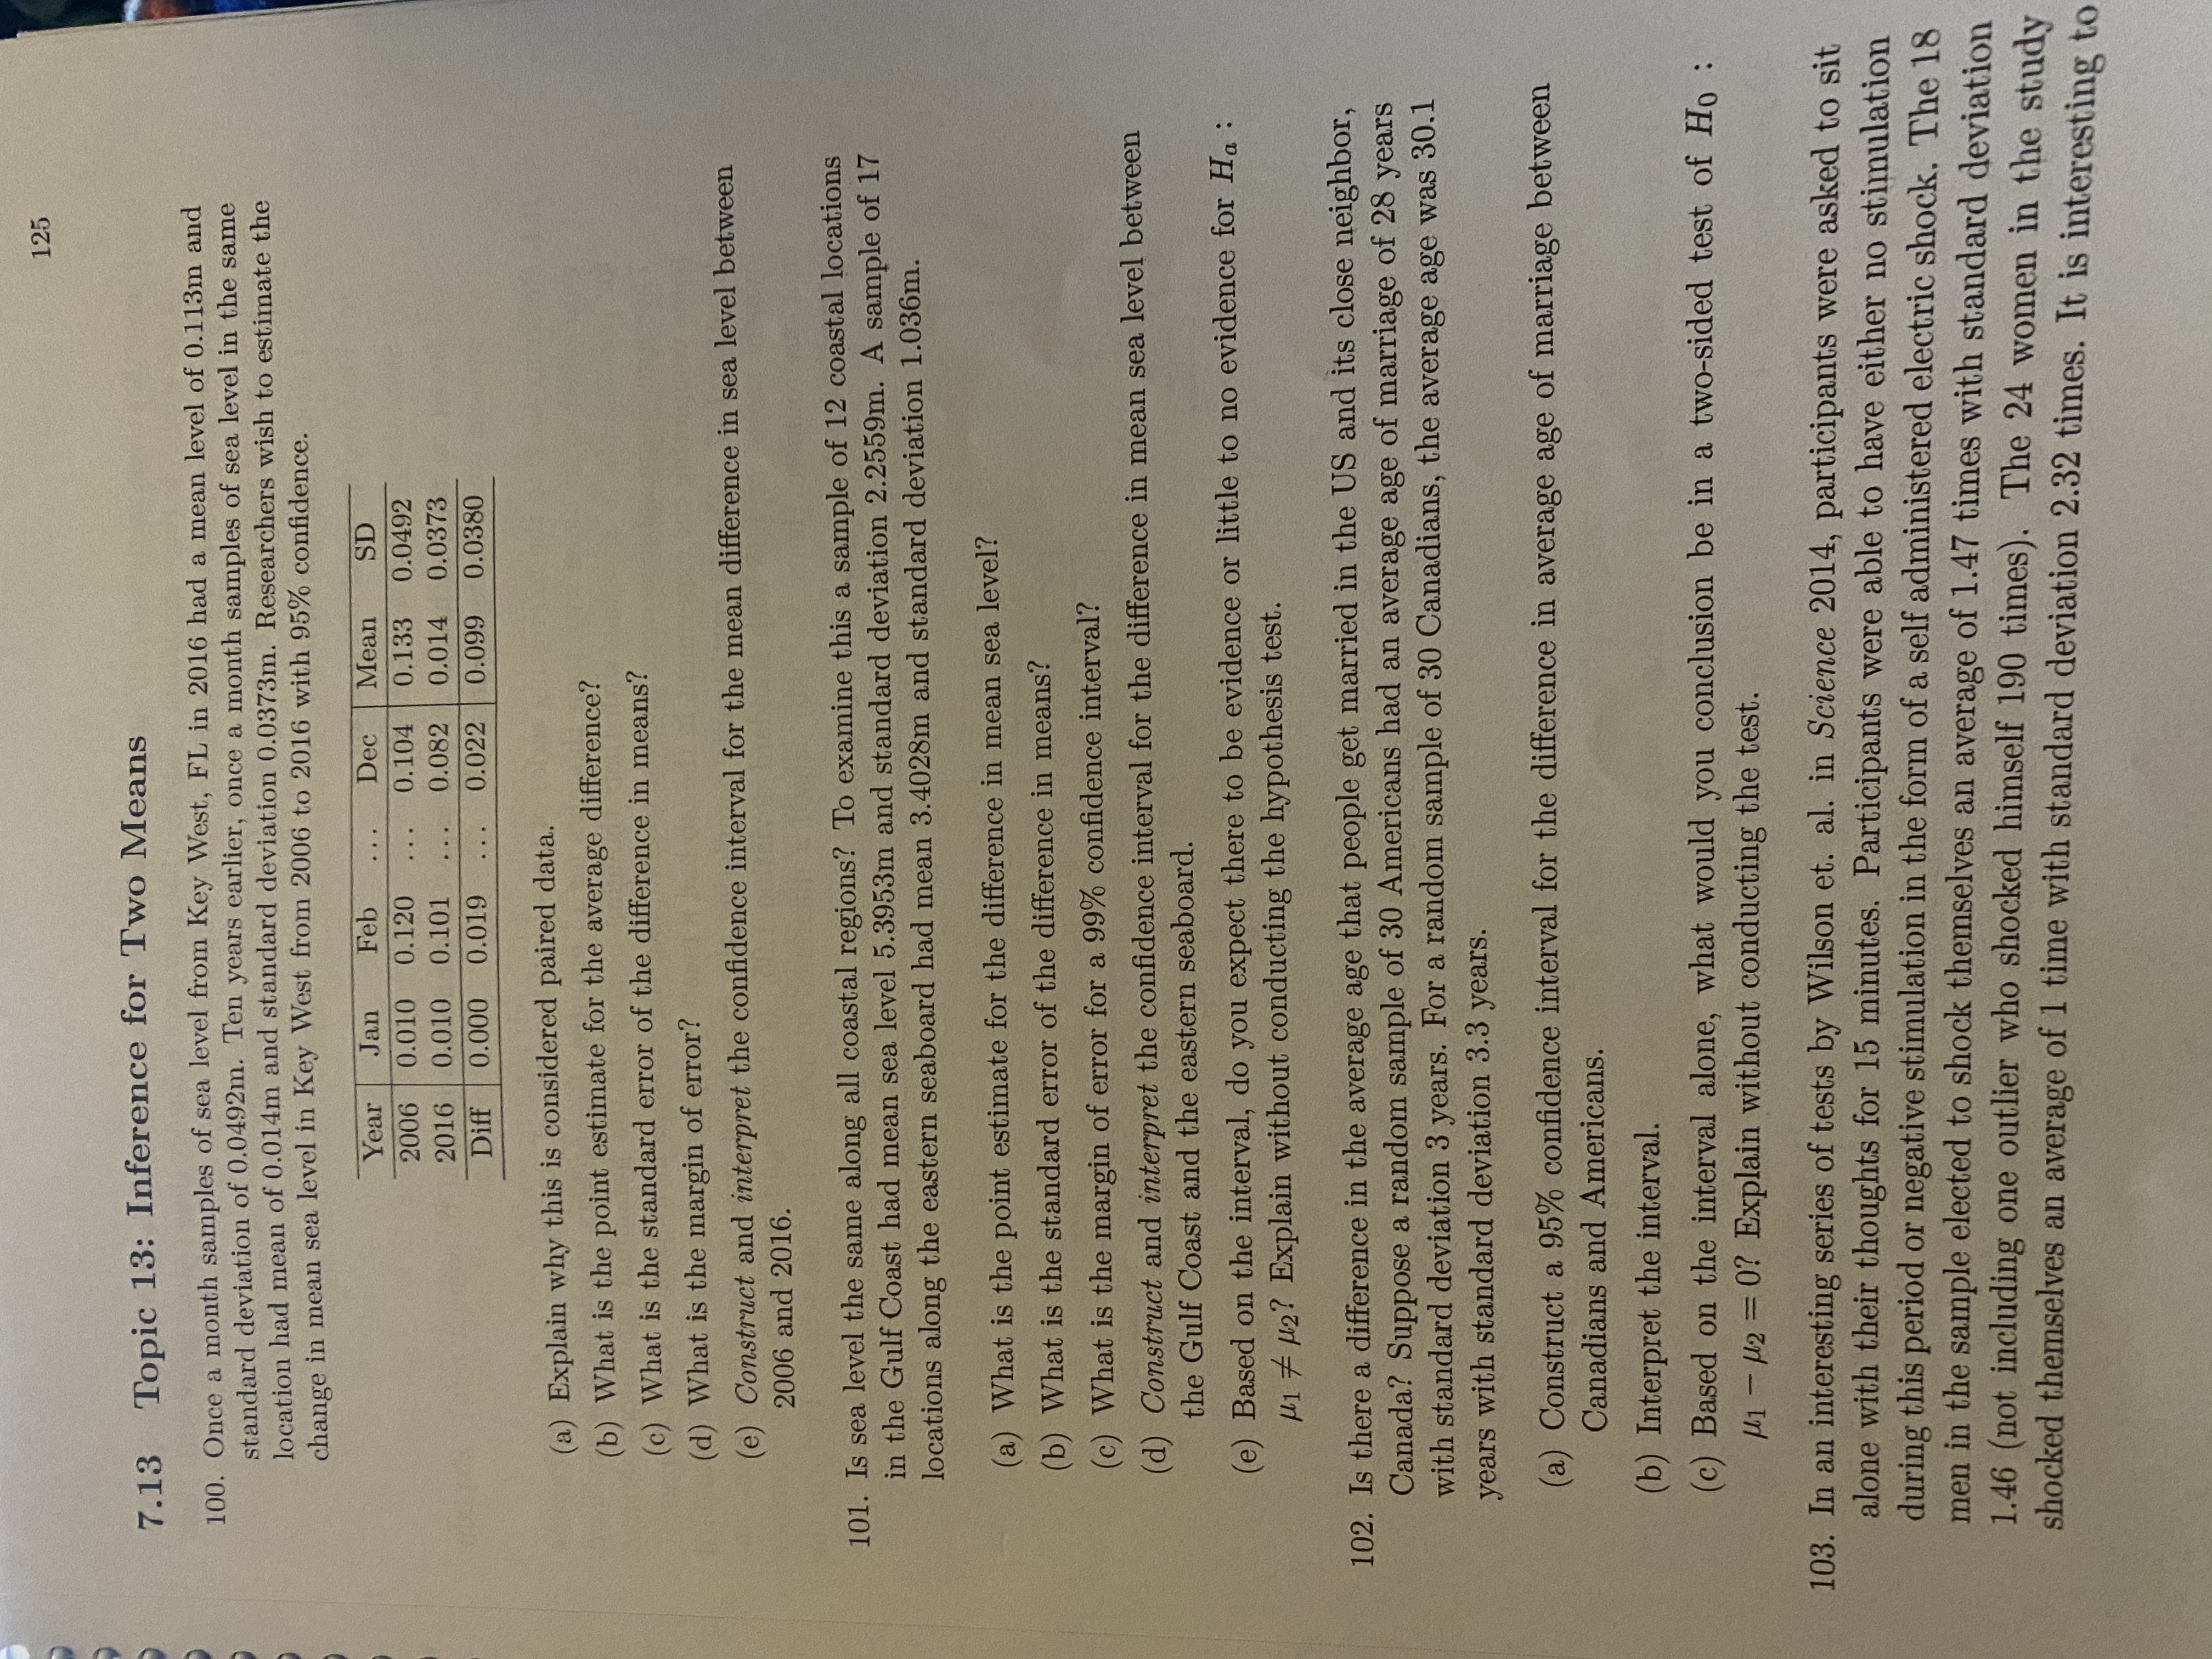

Transcribed Image Text:125
7.13 Topic 13: Inference for Two Means
100. Once a month samples of sea level from Key West, FL in 2016 had a mean level of 0.113m and
standard deviation of 0.0492m. Ten years earlier, once a month samples of sea level in the same
location had mean of 0.014m and standard deviation 0.0373m. Researchers wish to estimate the
change in mean sea level in Key West from 2006 to 2016 with 95% confidence.
Year
Jan
Feb
Dec
Mean
SD
2006
0.010
0.120
0.104
0.133
0.0492
2016
0.010
0.101
0.082
0.014
0.0373
...
Diff
0.000
0.019
0.022
0.099
0.0380
(a) Explain why this is considered paired data.
(b) What is the point estimate for the average difference?
(c) What is the standard error of the difference in means?
(d) What is the margin of error?
(e) Construct and interpret the confidence interval for the mean difference in sea level between
2006 and 2016.
101. Is sea level the same along all coastal regions? To examine this a sample of 12 coastal locations
in the Gulf Coast had mean sea level 5.3953m and standard deviation 2.2559m. A sample of 17
locations along the eastern seaboard had mean 3.4028m and standard deviation 1.036m.
(a) What is the point estimate for the difference in mean sea level?
(b) What is the standard error of the difference in means?
(c) What is the margin of error for a 99% confidence interval?
(d) Construct and interpret the confidence interval for the difference in mean sea level between
the Gulf Coast and the eastern seaboard.
(e) Based on the interval, do you expect there to be evidence or little to no evidence for Ha :
H17 42? Explain without conducting the hypothesis test.
102. Is there a difference in the average age that people get married in the US and its close neighbor,
Canada? Suppose a random sample of 30 Americans had an average age of marriage of 28 years
with standard deviation 3 years. For a random sample of 30 Canadians, the average age was 30.1
years with standard deviation 3.3 years.
(a) Construct a 95% confidence interval for the difference in average age of marriage between
Canadians and Americans.
(b) Interpret the interval.
(c) Based on the interval alone, what would you conclusion be in a two-sided test of Ho:
H1-2= 0? Explain without conducting the test.
%3D
103. In an interesting series of tests by Wilson et. al. in Science 2014, participants were asked to sit
alone with their thoughts for 15 minutes. Participants were able to have either no stimulation
during this period or negative stimulation in the form of a self administered electric shock. The 18
men in the sample elected to shock themselves an average of 1.47 times with standard deviation
1.46 (not including one outlier who shocked himself 190 times). The 24 women in the study
shocked themselves an average of 1 time with standard deviation 2.32 times. It is interesting to
Expert Solution
This question has been solved!
Explore an expertly crafted, step-by-step solution for a thorough understanding of key concepts.

This is a popular solution

Trending nowThis is a popular solution!

Step by stepSolved in 3 steps with 3 images

Knowledge Booster


Learn more about
Need a deep-dive on the concept behind this application? Look no further. Learn more about this topic, statistics and related others by exploring similar questions and additional content below.Similar questions
arrow_back_ios
arrow_forward_ios
Recommended textbooks for you
- MATLAB: An Introduction with ApplicationsStatisticsISBN:9781119256830Author:Amos GilatPublisher:John Wiley & Sons Inc
 Probability and Statistics for Engineering and th...StatisticsISBN:9781305251809Author:Jay L. DevorePublisher:Cengage Learning
 Statistics for The Behavioral Sciences (MindTap C...StatisticsISBN:9781305504912Author:Frederick J Gravetter, Larry B. WallnauPublisher:Cengage Learning
  Elementary Statistics: Picturing the World (7th E...StatisticsISBN:9780134683416Author:Ron Larson, Betsy FarberPublisher:PEARSON
 The Basic Practice of StatisticsStatisticsISBN:9781319042578Author:David S. Moore, William I. Notz, Michael A. FlignerPublisher:W. H. Freeman
 Introduction to the Practice of StatisticsStatisticsISBN:9781319013387Author:David S. Moore, George P. McCabe, Bruce A. CraigPublisher:W. H. Freeman
MATLAB: An Introduction with Applications
Statistics
ISBN:9781119256830
Author:Amos Gilat
Publisher:John Wiley & Sons Inc
Probability and Statistics for Engineering and th...
Statistics
ISBN:9781305251809
Author:Jay L. Devore
Publisher:Cengage Learning
Statistics for The Behavioral Sciences (MindTap C...
Statistics
ISBN:9781305504912
Author:Frederick J Gravetter, Larry B. Wallnau
Publisher:Cengage Learning
Elementary Statistics: Picturing the World (7th E...
Statistics
ISBN:9780134683416
Author:Ron Larson, Betsy Farber
Publisher:PEARSON
The Basic Practice of Statistics
Statistics
ISBN:9781319042578
Author:David S. Moore, William I. Notz, Michael A. Fligner
Publisher:W. H. Freeman
Introduction to the Practice of Statistics
Statistics
ISBN:9781319013387
Author:David S. Moore, George P. McCabe, Bruce A. Craig
Publisher:W. H. Freeman