
MATLAB: An Introduction with Applications
6th Edition
ISBN: 9781119256830
Author: Amos Gilat
Publisher: John Wiley & Sons Inc
expand_more
expand_more
format_list_bulleted
Related questions
Concept explainers
Question
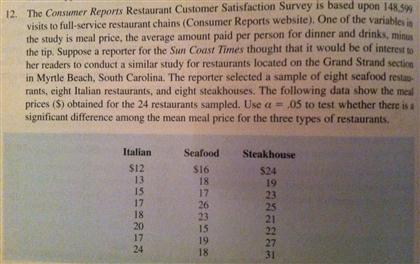

Transcribed Image Text:12. The Consumer Reports Restaurant Customer Satisfaction Survey is based upon 148 59
visits to full-service restaurant chains (Consumer Reports website). One of the variables in
the study is meal price, the average amount paid per person for dinner and drinks, minu
the tip. Suppose a reporter for the Sun Coast Times thought that it would be of interest to
her readers to conduct a similar study for restaurants located on the Grand Strand section
in Mynle Beach, South Carolina. The reporter selected a sample of eight seafood restau
rants, eight Italian restaurants, and eight steakhouses. The following data show the meal
prices ($) obtained for the 24 restaurants sampled. Use a = 05 to test whether there is a
significant difference among the mean meal price for the three types of restaurants.
Italian
Seafood
Steakhouse
S16
18
17
S12
13
15
17
18
20
17
24
$24
19
23
25
21
22
27
31
26
23
15
19
18
Expert Solution
This question has been solved!
Explore an expertly crafted, step-by-step solution for a thorough understanding of key concepts.

This is a popular solution

Trending nowThis is a popular solution!

Step by stepSolved in 3 steps with 1 images

Knowledge Booster


Learn more about
Need a deep-dive on the concept behind this application? Look no further. Learn more about this topic, statistics and related others by exploring similar questions and additional content below.Similar questions
- A nationwide job recruiting firm wants to compare the annual incomes for childcare workers in Texas and Indiana. Due to recent trends in the childcare industry, the firm suspects that the mean annual income of childcare workers in Texas is less than the mean annual income of childcare workers in Indiana. To see if this is true, the firm selected a random sample of 20 childcare workers from Texas and an independent random sample of 20 childcare workers from Indiana and asked them to report their mean annual income. The data obtained were as follows. Annual income in dollars Texas 37093 , 33960 , 35692 , 29528 , 30978 , 35504 , 26961 , 28380 , 37537 , 25341 , 34837 , 36489 , 33633 , 41229 , 43577 , 27644 , 43364 , 28415 , 28919 , 34096 Indiana 33672 , 46452 , 35900 , 28486 , 46528 , 34252 , 40952 , 42164 , 36298 , 38828 , 32690 , 29157 , 42770 , 35527 , 40804 ,…arrow_forwardA psychologist has designed an index to measure the social perspectives of elementary school children. The index is based on ratings of a child’s responses to questions about a set of photographs showing different social situations. The following are the indices measured on a random sample of 16 children attending elementary school in a particular district. 48, 75, 69, 58, 60, 68, 59, 66, 71, 52, 49, 60, 54, 55, 70, 57 For the data, the mean index is 60.69 and the standard deviation is 8.26. Perform a statistical test to determine if the population mean index is greater than 50. H0: HA: a). Test Statistic = b). P-value = c). Rejection region= d). Decision in the context of the problem=arrow_forwardA lecturer would like to analyse whether there is a relationship between the country of origin of international students and the number of hours per day they spent on social media. To perform the study sbove the lecturer sent an email to all the students renrolled in his class and collected the responses from whoever replied to hid email and used it as his sample data. is the data collected in this manner baised? Explain.arrow_forward
- Three sections A, B, and C took the final exam in MATH. Section A with 30 students has a mean score of 88, while section B with 35 students has a mean score of 81. If section C has a mean score of 81 and the overall mean of the three sections is 83, how many students took the exam in section C?arrow_forwardif a data sample has a mode of 140, a median of 130, and a mean of 120 is the distribution of the data is positively skewed?arrow_forwardC) Does the data provide evidence of an association between age and opinion of the band? Justify your answer.arrow_forward
- I. Background The Food and Drug Administration (FDA) tries to find out whether there is a relation between the number of years people smoked and the percentage of lung damage. FDA asks you for your help to find it out. You interviewed twenty people who have smoked and obtained the following data. II. Technical report: d) Choose your own significance level a (1 suggests 0.1, 0.05 or 0.01). State and test the hypothesis. Explain what your findings mean. e) Do your observations in part (b) agree to the results from part (c) and (d)? Explain f) Find the regression line equation. Explain what the line implies. g) Draw the regression line on your scatter plot. h) A man has smoked 13 years. predict the percentage for damage on his lung. (( please check images for accuracy, thank you!!!))arrow_forwardQuestion 2. Crescent Oil has developed three new blends of gasoline and must decide which blend or blends to produce and distribute. A study of the miles per gallon ratings of the three blends is being conducted to determine if the mean ratings are the same for the three blends. Five automobiles have been tested using each of the three gasoline blends and the miles per gallon ratings; Automobile (Block) 12345 2 4 5 Type of Gasoline (Treatment) Blend X Blend Y Blend Z 31 30 29 33 26 30 29 29 31 25 29.8 30 29 28 Treatment Means a. Compute the analysis of variance for the randomized block design 28.8 29 26 28.4 Block Means 30.333 29.333 28.667 31.000 25.667arrow_forwardIf a teacher wants to assess whether there is a relationship between males and females on test performance, the most appropriate statistical test would bearrow_forward
- can you please make statsitics ( bar graphs , pie charts, line graphs) for all these results in the survey down belowarrow_forwardMr. Friend noticed that meetings tended to start late when there were a lot of people in attendance and decided to study that relationship. He collecting data on the number of people who were attending each meeting and the number of minutes late that the meeting started. He noticed there was one point that seemed unusual, so he removed it from the data set. What is true about the point that was removed? a. the point is not unusualb. It is an influential observationc. It has the largest residuald. The slope changes little when the point is removedSelected:e. The correlation is lower with the removal of the pointarrow_forwardThis question has 5 parts, Thank you.arrow_forward
arrow_back_ios
SEE MORE QUESTIONS
arrow_forward_ios
Recommended textbooks for you
- MATLAB: An Introduction with ApplicationsStatisticsISBN:9781119256830Author:Amos GilatPublisher:John Wiley & Sons Inc
 Probability and Statistics for Engineering and th...StatisticsISBN:9781305251809Author:Jay L. DevorePublisher:Cengage Learning
 Statistics for The Behavioral Sciences (MindTap C...StatisticsISBN:9781305504912Author:Frederick J Gravetter, Larry B. WallnauPublisher:Cengage Learning
  Elementary Statistics: Picturing the World (7th E...StatisticsISBN:9780134683416Author:Ron Larson, Betsy FarberPublisher:PEARSON
 The Basic Practice of StatisticsStatisticsISBN:9781319042578Author:David S. Moore, William I. Notz, Michael A. FlignerPublisher:W. H. Freeman
 Introduction to the Practice of StatisticsStatisticsISBN:9781319013387Author:David S. Moore, George P. McCabe, Bruce A. CraigPublisher:W. H. Freeman
MATLAB: An Introduction with Applications
Statistics
ISBN:9781119256830
Author:Amos Gilat
Publisher:John Wiley & Sons Inc
Probability and Statistics for Engineering and th...
Statistics
ISBN:9781305251809
Author:Jay L. Devore
Publisher:Cengage Learning
Statistics for The Behavioral Sciences (MindTap C...
Statistics
ISBN:9781305504912
Author:Frederick J Gravetter, Larry B. Wallnau
Publisher:Cengage Learning
Elementary Statistics: Picturing the World (7th E...
Statistics
ISBN:9780134683416
Author:Ron Larson, Betsy Farber
Publisher:PEARSON
The Basic Practice of Statistics
Statistics
ISBN:9781319042578
Author:David S. Moore, William I. Notz, Michael A. Fligner
Publisher:W. H. Freeman
Introduction to the Practice of Statistics
Statistics
ISBN:9781319013387
Author:David S. Moore, George P. McCabe, Bruce A. Craig
Publisher:W. H. Freeman