MATLAB: An Introduction with Applications
6th Edition
ISBN: 9781119256830
Author: Amos Gilat
Publisher: John Wiley & Sons Inc
expand_more
expand_more
format_list_bulleted
Concept explainers
Question
2) a, b, and c.
Solve them step by step.

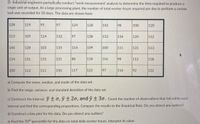
Transcribed Image Text:2)- Industrial engineers periodically.conduct "work measurement' analysis to determine the time required to produce a
single unit of output. At a large processing plant, the number of total worker-hours required per day to perform a certain
task was recorded for 50 days. The data are shown here:
128
119
95
97
124
128
142
98
108
120
113
109
124
132
97
138
133
136
120
112
146
128
103
|135
114
109
100
111
131
113
124
131
133
|131
88
118
116
98
112
138
100
112
111
150
117
122
97
116
92
122
a) Compute the mean, median, and mode of the data set.
b) Find the range, variance, and standard deviation of the data set.
c) Construct the interval y to, y ± 2o, and y + 30. count the number of observations that fall within each
interval and find the corresponding proportions. Compare the results to the Empirical Rule. Do you detect any outliers?
d) Construct a box plot for the data. Do you detect any outliers?
e) Find the 70th percentile for the data on total daily worker-hours. Interpret its value.
Expert Solution
This question has been solved!
Explore an expertly crafted, step-by-step solution for a thorough understanding of key concepts.
This is a popular solution
Trending nowThis is a popular solution!
Step by stepSolved in 2 steps

Knowledge Booster
Learn more about
Need a deep-dive on the concept behind this application? Look no further. Learn more about this topic, statistics and related others by exploring similar questions and additional content below.Similar questions
- Quiz 5-1: Midse Angle Bisectors, Part I: Midsegments 1. If D, E, and Fare midpoints of the sides of AABC, find the perimeter of AABC. 7. 12 D. 16 3. Find m/PST. (11x-3) (5x-9)"arrow_forwardConsider the following linear equations: 2x + 4y + 8z = 5 2x + (17 k)y +7z = 7 2x + 4y + (12 k)z =k+10arrow_forwardSolve the problem. 1) Aaron invested a total of $4,100, some in an account earning 8% simple interest, and the rest in an account earning 5% simple interest. How much did he invest in each account if after one year he earned $211 in interest? 1)arrow_forward
- 1. One brand of cleaner used to etch concrete is 25% acid. A stronger industrial-strength cleaner is 50% acid. How many galloons of each cleaner should be mixed to produce 20 galloons of a 40% acid solution?arrow_forward2. You have some coins, each of which is a penny (1 cent), a nickel (5 cents), a dime (10 cents), or a quarter (25 cents). You know that • you have twice as many pennies as nickels, • the number of dimes is one more than the number of pennies and nickels combined, you have 34 coins in total, • and the total value of your coins is $2.70 (270 cents). (a) Set up a system of linear equations for the numbers of pennies, nickels, dimes, and quarters you have. (b) Determine how many coins of each type you have, by solving the system from part (a).arrow_forward4. Solve. Find all the solutions for each questionarrow_forward
- 5. Solve 4cos²0 - 1 = 0 and write the general solution.arrow_forward23) Max and Jill both uses quarters to fill a parking meter. Max's parking meter is for 2 hours and Jill's parking meter is for 1 hour and 30 minutes. Max goes into a store and when he comes back, he sees that his parking meter has 4 of the time left. Jill goes for a run and when she comes back she sees that her parking meter has 4 of the time left. Who has more time left? By how many minutes?arrow_forward5) C for B. Solve D-Aarrow_forward
- 7. Find the solution. (x + 1)² + 5 = 69arrow_forward1 2 -3 5 1 4 -6 | 0 000 14) 0 Write the solution as an ordered triple, if possible.arrow_forwardMead. , Two-step equations Wednesdby 10 10 Two-step equations - integers Solve each equation. 1) -5n + 8 =-7 2) 28 =-2- 5.x 4) -10a – 5 = 135 3) 2=7+- 6) +9 = 2 5) 13 = + 8arrow_forward
arrow_back_ios
arrow_forward_ios
Recommended textbooks for you
 MATLAB: An Introduction with ApplicationsStatisticsISBN:9781119256830Author:Amos GilatPublisher:John Wiley & Sons Inc
 Probability and Statistics for Engineering and th...StatisticsISBN:9781305251809Author:Jay L. DevorePublisher:Cengage Learning
 Statistics for The Behavioral Sciences (MindTap C...StatisticsISBN:9781305504912Author:Frederick J Gravetter, Larry B. WallnauPublisher:Cengage Learning
 Elementary Statistics: Picturing the World (7th E...StatisticsISBN:9780134683416Author:Ron Larson, Betsy FarberPublisher:PEARSON
 The Basic Practice of StatisticsStatisticsISBN:9781319042578Author:David S. Moore, William I. Notz, Michael A. FlignerPublisher:W. H. Freeman
 Introduction to the Practice of StatisticsStatisticsISBN:9781319013387Author:David S. Moore, George P. McCabe, Bruce A. CraigPublisher:W. H. Freeman

MATLAB: An Introduction with Applications
Statistics
ISBN:9781119256830
Author:Amos Gilat
Publisher:John Wiley & Sons Inc

Probability and Statistics for Engineering and th...
Statistics
ISBN:9781305251809
Author:Jay L. Devore
Publisher:Cengage Learning

Statistics for The Behavioral Sciences (MindTap C...
Statistics
ISBN:9781305504912
Author:Frederick J Gravetter, Larry B. Wallnau
Publisher:Cengage Learning

Elementary Statistics: Picturing the World (7th E...
Statistics
ISBN:9780134683416
Author:Ron Larson, Betsy Farber
Publisher:PEARSON

The Basic Practice of Statistics
Statistics
ISBN:9781319042578
Author:David S. Moore, William I. Notz, Michael A. Fligner
Publisher:W. H. Freeman

Introduction to the Practice of Statistics
Statistics
ISBN:9781319013387
Author:David S. Moore, George P. McCabe, Bruce A. Craig
Publisher:W. H. Freeman