
MATLAB: An Introduction with Applications
6th Edition
ISBN: 9781119256830
Author: Amos Gilat
Publisher: John Wiley & Sons Inc
expand_more
expand_more
format_list_bulleted
Related questions
Concept explainers
Question
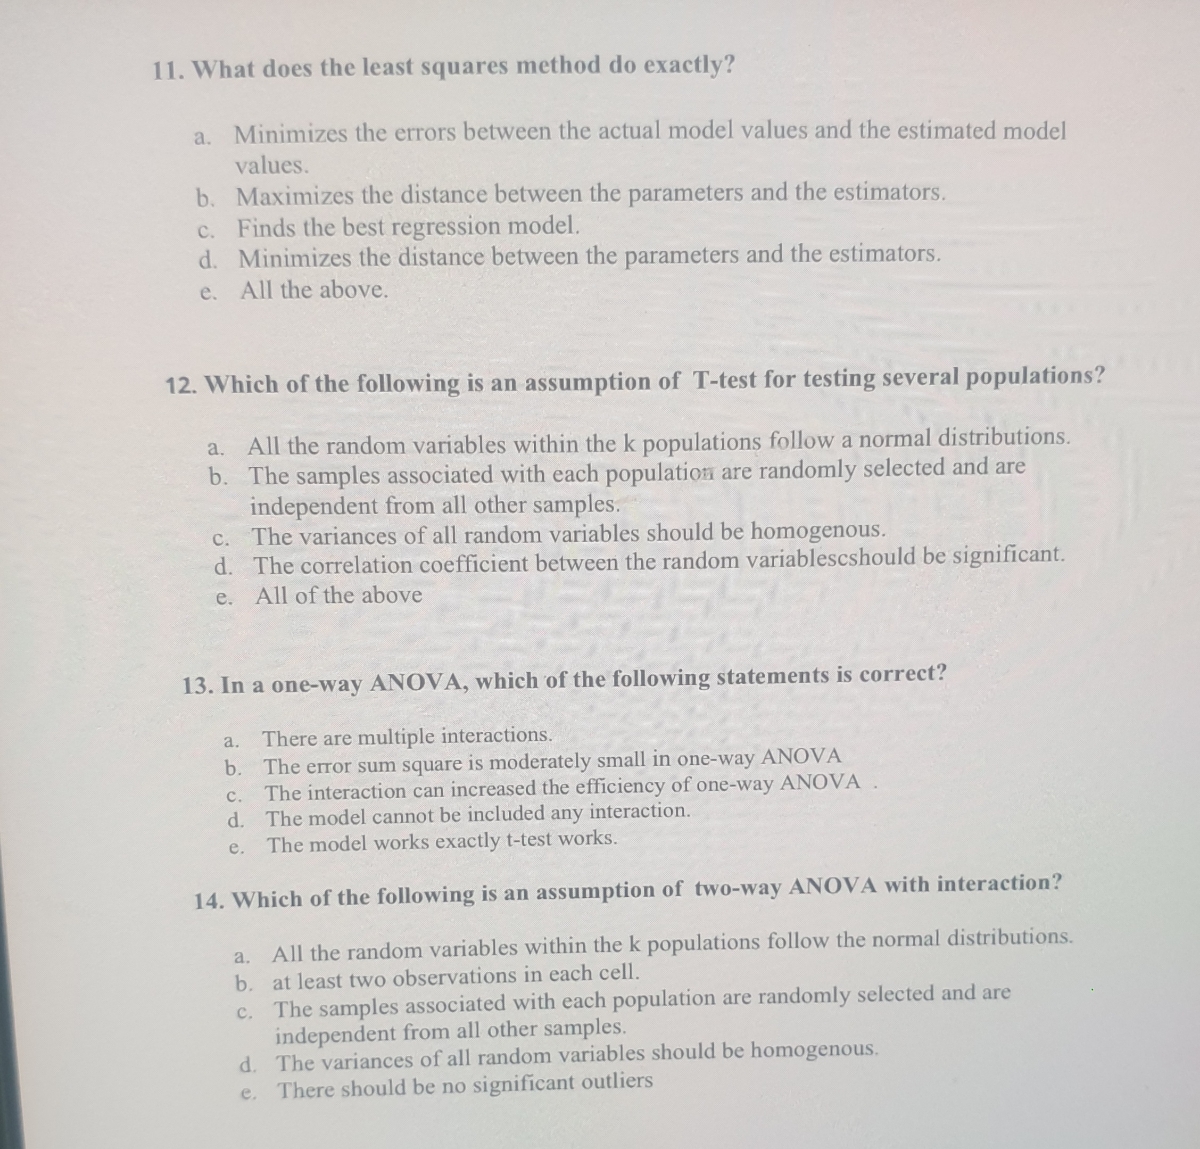

Transcribed Image Text:11. What does the least squares method do exactly?
a. Minimizes the errors between the actual model values and the estimated model
values.
b. Maximizes the distance between the parameters and the estimators.
c. Finds the best regression model.
d. Minimizes the distance between the parameters and the estimators.
e. All the above.
12. Which of the following is an assumption of T-test for testing several populations?
a. All the random variables within the k populations follow a normal distributions.
b. The samples associated with each population are randomly selected and are
independent from all other samples.
c. The variances of all random variables should be homogenous.
d. The correlation coefficient between the random variablescshould be significant.
e. All of the above
13. In a one-way ANOVA, which of the following statements is correct?
There are multiple interactions.
b. The error sum square is moderately small in one-way ANOVA
The interaction can increased the efficiency of one-way ANOVA .
d. The model cannot be included any interaction.
The model works exactly t-test works.
a.
с.
е.
14. Which of the following is an assumption of two-way ANOVA with interaction?
All the random variables within the k populations follow the normal distributions.
b. at least two observations in each cell.
The samples associated with each population are randomly selected and are
independent from all other samples.
d. The variances of all random variables should be homogenous.
e. There should be no significant outliers
a.
с.
Expert Solution
This question has been solved!
Explore an expertly crafted, step-by-step solution for a thorough understanding of key concepts.

This is a popular solution

Trending nowThis is a popular solution!

Step by stepSolved in 2 steps with 1 images

Knowledge Booster


Learn more about
Need a deep-dive on the concept behind this application? Look no further. Learn more about this topic, statistics and related others by exploring similar questions and additional content below.Similar questions
- Laetisaric acid is a compound that holds promise for control of fungus diseases in crop plants. Below is the least-squares regression equation to predict fungus growth (mm) from laetisaric acid concentration (µG/ml): ŷ =31.8 -0.712x Which of the following statements is correct? A. Above-average values of laetisaric acid concentration tend to accompany above-average values of fungus growth. B. From the given regression equation, we know the correlation is negative and we can say what the exact value of that correlation is. C. When fungus growth increases by 1 mm, the laetisaric acid concentration decreases by 0.712 µG/ml. D. None of the above.arrow_forwardThe residual plot for a linear regression model is shown below. Assess the fit of the linear model, and justify your answer. The line is a good fit because the points on the residual plot have a clear pattern. The line is a good fit because the points on the residual plot do not have any noticeable pattern. The line is not a good fit because the points on the residual plot do not have any noticeable pattern. The line is not a good fit because the points on the residual plot have a clear pattern.arrow_forwardI need the right answer to d, e, and f ASAP, please.arrow_forward
- For a linear regression problem, The actual observed y-value when x = 2 is y = 6. The least squares line is y = 2x+1. The predicted value when x=2 is y = 5. Determine the value of the residual (prediction error) oooo 1 6 5 Cannot be determined from the information givenarrow_forwardConsider the following probability. P(z ≥ 1.33) a) Let z be a random variable with a standard normal distribution. Find the indicated probability. (Round your answer to four decimal places.) b) Shade the corresponding area under the standard normal curve. Choose the correct graph.arrow_forwardA student is preparing to take a stand allies exam she was told that she needs to get plenty of sleep the night before the exam she is interested in the relationship between the number of hours of sleep a student gets her for an exam and the score earned on the exam. She collects information from 10 other students who have already taken the exam as shown on the table. she fits at least squares regression line to the data and determines the equation of the line is why equals 26-0.18 X where why is the score earn on the exam and ask is the number of hours of sleep the night before the exam. The residual is given. based on the residual plot is the linear model appropriate? no, there is no clear pattern in the residual plot. yes, there is no clear pattern in the residual plot. no, the student who got the most you've had a negative residual yes, there are more negative residuals (6) then positive residuals (4)arrow_forward
- (e) Find the least-squares regression line treating square footage as the explanatory variable.arrow_forwardHow is the Polynomial Regression model different from the Simple Linear Regression and Multiple Linear Regression models? Select an answer: a. The independent variables are categorical instead of numerical. b. There are multiple dependent variables instead of just one. c. The independent variable is raised to a higher power (squared, cubed, etc.). d. The dependent variable is raised to a higher power (squared, cubed, etc.).arrow_forwardConstruct and interpret a 95% prediction interval for the proceeds when the number of issues is 602.arrow_forward
- Ap Statsarrow_forwardBelow table contains a data sample where X is the independent, and Y the dependent variable. Using the data, please conduct a regression analysis. Determine first the regression equation with the help of below graph and table, then answer all the questions. 1. The value of cell a is 2. The value of cell b is 3: The value of cell c is 4: The value of cell d is 5: The value of cell e is 6: The value of cell f is 7: The value of cell g is 8. The value of cell h is 9: The value of cell i is 10: The value of cell j is 11: The value of cell k is 12: The value of cell l is 13: The value of cell m is 14: The value of cell n is 15: The value of cell o is 16: The value of cell p is 17: The value of cell q is 18: The value of cell r is 19: The value of cell s is 20: The value of cell t is 21: The value of cell u is 22: The value of cell v is 23: The value of cell w is 24: The value of cell x is 25: The value of cell y is 26: The value of cell z is 27: The value of cell aa is 28: The value of cell…arrow_forwardst e this 1:33 38% K A pediatrician wants to determine the relation that exists between a child's height, x, and head circumference, y. She randomly selects 11 children from her practice, measures their heights and head circumferences, and obtains the accompanying data. Complete parts (a) through (g) below. Click the icon to view the children's data. (a) Find the least-squares regression line treating height as the explanatory variable and head circumference as the response variable. Data Table y = X + (Round the slope to three decimal places and round the constant to one decimal place as needed.) View an example Height (inches), X Head Circumference (inches), y D 27.75 17.8 24.75 17.3 25.75 17.4 26.25 17.7 25 17.1 28.25 17.9 26.75 17.5 27 17.7 26 26 27.5 ||| = Print Get more help. (...) 17.5 17.7 17.8 1 LTE2 + ... Done O X Clear all Check answerarrow_forward
arrow_back_ios
arrow_forward_ios
Recommended textbooks for you
- MATLAB: An Introduction with ApplicationsStatisticsISBN:9781119256830Author:Amos GilatPublisher:John Wiley & Sons Inc
 Probability and Statistics for Engineering and th...StatisticsISBN:9781305251809Author:Jay L. DevorePublisher:Cengage Learning
 Statistics for The Behavioral Sciences (MindTap C...StatisticsISBN:9781305504912Author:Frederick J Gravetter, Larry B. WallnauPublisher:Cengage Learning
  Elementary Statistics: Picturing the World (7th E...StatisticsISBN:9780134683416Author:Ron Larson, Betsy FarberPublisher:PEARSON
 The Basic Practice of StatisticsStatisticsISBN:9781319042578Author:David S. Moore, William I. Notz, Michael A. FlignerPublisher:W. H. Freeman
 Introduction to the Practice of StatisticsStatisticsISBN:9781319013387Author:David S. Moore, George P. McCabe, Bruce A. CraigPublisher:W. H. Freeman
MATLAB: An Introduction with Applications
Statistics
ISBN:9781119256830
Author:Amos Gilat
Publisher:John Wiley & Sons Inc
Probability and Statistics for Engineering and th...
Statistics
ISBN:9781305251809
Author:Jay L. Devore
Publisher:Cengage Learning
Statistics for The Behavioral Sciences (MindTap C...
Statistics
ISBN:9781305504912
Author:Frederick J Gravetter, Larry B. Wallnau
Publisher:Cengage Learning
Elementary Statistics: Picturing the World (7th E...
Statistics
ISBN:9780134683416
Author:Ron Larson, Betsy Farber
Publisher:PEARSON
The Basic Practice of Statistics
Statistics
ISBN:9781319042578
Author:David S. Moore, William I. Notz, Michael A. Fligner
Publisher:W. H. Freeman
Introduction to the Practice of Statistics
Statistics
ISBN:9781319013387
Author:David S. Moore, George P. McCabe, Bruce A. Craig
Publisher:W. H. Freeman