
Related questions
11.- Parkinson’s disease affects internally generated movements such as movements recalled from memory. Following is a stem-and-leaf diagram of the ages, in years, at which a sample of 14 patients experienced the onset of symptoms of Parkinson’s disease. How many of these 14 patients were:
a). under 45 years old at the onset of symptoms?
b). at least 65 years old at the onset of symptoms?
c). between 50 years old and 64 years old, inclusive, at the onset of symptoms?
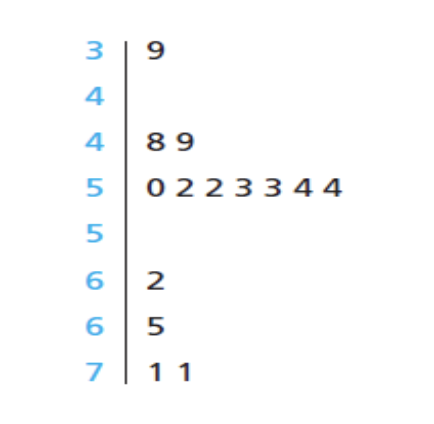

The stem and leaf plot is given. From the stem and leaf plot first let us find the data set. In the stem and leaf plot , stem part represent the digit at the tenth place and leaf part represent the digit at unit place.
For example.
3 (stem) | 0 9 (leaf)
The data set will be = {30,39}
Now, let us write the dataset from the above stem and leaf plot.
Dataset = {39,48,49,50,52,52,53,53,54,54,62,65,71,71}
a. From the data set we can see only one patient at the onset of symptoms who is under 45 years old.
So, Number of patients at the onset of symptoms = 1

Trending nowThis is a popular solution!

Step by stepSolved in 3 steps


- 6) The mean salary of 5 employees is $41800. The employee salaries have 2 modes: $33000 and $51500. If the median salary gets a $1300 raise, then... Hint: It will help to write down what salaries you know of the five and think about how you normally calculate mean and median.. a) What is the new mean? New Mean = $ b) What is the new median?. New Median = $arrow_forward41. Nineteen immigrants to the U.S were asked how many years, to the nearest year, they have lived in the U.S. The data are as follows: 2; 5; 7; 2; 2; 10; 20; 15; 0; 7; 0; 20; 5; 12; 15; 12; 4; 5; 10. Table 1.15 was produced. Data O 2 4 5 7 10 12 15 20 Frequency Relative Frequency 2 3 3 2 2 2 1 1 № 19 3 19 19 3 10 份 2 19 19 19 2 19 1 19 19 Cumulative Relative Frequency 0.1053 0.2632 0.3158 0.4737 0.5789 0.6842 0.7895 0.8421 1.0000 Table 1.15 Frequency of Immigrant Survey Responses M Fix the errors in Table 1.15. Also, explain how someone might have arrived at the incorrect number(s). b. Explain what is wrong with this statement: "47 percent of the people surveyed have lived in the U.S. for 5 years." c. Fix the statement in b to make it correct. d. What fraction of the people surveyed have lived in the U.S. five or seven years? e. What fraction of the people surveyed have lived in the U.S. at most 12 years? f. What fraction of the people surveyed have lived in the U.S. fewer than 12…arrow_forwardShow work please!arrow_forward
- 1. The percentage of 12- to 17-year-olds who reported talking at least once in the past year with their parents about the dangers of drug, tobacco, or alcohol is 60% nationally. A state youth council believes this proportion is higher in their state, where there has been an intense media campaign about this issue. A survey of randomly chosen students from across the state shows 1032 of 1642 students reporting they are having these conversations with their parents. Is there evidence that the percent of students using drugs, tobacco or alcohol in this state is above the national rate?arrow_forward13) In a clinical study of an allergy drug, 115 of the 260 subjects reported experiencing significant relief from their symptoms. From the data, a 90% C.I. for the percentage of all subjects reported experiencing significant relief from their symptoms is (,blank ), blank (round to the 3rd decimal place).arrow_forwardDo all the cards look correct? And the one that says " the spread of the data (range) is 20" which group does that one belong to?arrow_forward
- MATLAB: An Introduction with ApplicationsStatisticsISBN:9781119256830Author:Amos GilatPublisher:John Wiley & Sons Inc
 Probability and Statistics for Engineering and th...StatisticsISBN:9781305251809Author:Jay L. DevorePublisher:Cengage Learning
 Statistics for The Behavioral Sciences (MindTap C...StatisticsISBN:9781305504912Author:Frederick J Gravetter, Larry B. WallnauPublisher:Cengage Learning
  Elementary Statistics: Picturing the World (7th E...StatisticsISBN:9780134683416Author:Ron Larson, Betsy FarberPublisher:PEARSON
 The Basic Practice of StatisticsStatisticsISBN:9781319042578Author:David S. Moore, William I. Notz, Michael A. FlignerPublisher:W. H. Freeman
 Introduction to the Practice of StatisticsStatisticsISBN:9781319013387Author:David S. Moore, George P. McCabe, Bruce A. CraigPublisher:W. H. Freeman