Advanced Engineering Mathematics
10th Edition
ISBN: 9780470458365
Author: Erwin Kreyszig
Publisher: Wiley, John & Sons, Incorporated
expand_more
expand_more
format_list_bulleted
Question
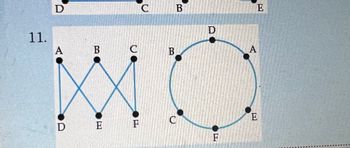
Are these to graphs equivalent or not and why

Transcribed Image Text:11.
A
B
D E
C
F
B
B
C
D
F
E
A
E
Expert Solution
arrow_forward
Step 1
Two graphs are equivalent if they both have the same number of edges and vertices. Moreover, if any vertex is connected to another vertex in one graph, the same should be the case in the second graph.
Given that there are two graphs.
The first graph has vertices, namely, and the second graph also has vertices, namely, .
So, the vertices are the same in both graphs.
The edges in the first graph are .
The edges in the second graph are .
Step by stepSolved in 2 steps

Knowledge Booster
Similar questions
- Hi, I am trying to figure out your graph (the answer) with the option that I posted on my question: can you so kind and get into more detail on the answer? Thanksarrow_forwardLets just say for a question similar, how do I know what numbers to plug in for a valid graph?arrow_forwardI need help determining what graphs to use for what reason. .. (there can be more than one answer)Ex: Major field of study for a group of students:A. dotplot, B. Histogram, C. Stem and Leaf, D. Barchart, E. BoxplotEx: weight of backpacks of studentsA. Boxplot, B Dotplot, C. Histogram, D. Barchart, E. Stem and Leaf.arrow_forward
- Between 1980 and 2012, the number of adults in a certain country who were overweight more than doubled from 17% to 36%. Use this information to answer parts a and b. (a) Construct a graphic that is not misleading to depict this situation. Choose the correct graph beloW. O A. C. O D. OB. 60- 60- 50- 40- 30- 20- 10- 0- 60- 60- 50- 50- 40- 20- 10- 1980 2012 1980 2012 1980 2012 1980 2012 (b) Construct a misleading graphic that makes it appear that the percent of overweight adults has more than tripled between 1980 and 2012. Choose the correct graph below. O A. O B. Oc. OD. 45- 45- 55- 40- 35- 30어 20- 10- 25- 15- 0- 1980 2012 15- 1980 2012 1980 2012 1980 2012 48°F A O Type here to search lyp ins prt sc fg 144 f12 delete home f5 f6 f8 AAA Percentage Percentage Percentage Percentage Percentage Percentage Percentage Percentage 20arrow_forwardConsider the following graph. Step 2 of 2: Determine the domain and range of the graph. Express your answer in interval notation. Enable Zoom/Pan 10 -5 Ay 10 5 5 10 10 Xarrow_forward7). Which type of graph would be most appropriate for showing the results of different categories? For example, favorite flavor of ice cream at a local ice cream shop.arrow_forward
arrow_back_ios
arrow_forward_ios
Recommended textbooks for you
 Advanced Engineering MathematicsAdvanced MathISBN:9780470458365Author:Erwin KreyszigPublisher:Wiley, John & Sons, Incorporated
 Numerical Methods for EngineersAdvanced MathISBN:9780073397924Author:Steven C. Chapra Dr., Raymond P. CanalePublisher:McGraw-Hill Education
 Introductory Mathematics for Engineering Applicat...Advanced MathISBN:9781118141809Author:Nathan KlingbeilPublisher:WILEY
 Mathematics For Machine TechnologyAdvanced MathISBN:9781337798310Author:Peterson, John.Publisher:Cengage Learning,


Advanced Engineering Mathematics
Advanced Math
ISBN:9780470458365
Author:Erwin Kreyszig
Publisher:Wiley, John & Sons, Incorporated

Numerical Methods for Engineers
Advanced Math
ISBN:9780073397924
Author:Steven C. Chapra Dr., Raymond P. Canale
Publisher:McGraw-Hill Education

Introductory Mathematics for Engineering Applicat...
Advanced Math
ISBN:9781118141809
Author:Nathan Klingbeil
Publisher:WILEY

Mathematics For Machine Technology
Advanced Math
ISBN:9781337798310
Author:Peterson, John.
Publisher:Cengage Learning,

