
A First Course in Probability (10th Edition)
10th Edition
ISBN: 9780134753119
Author: Sheldon Ross
Publisher: PEARSON
expand_more
expand_more
format_list_bulleted
Related questions
Question
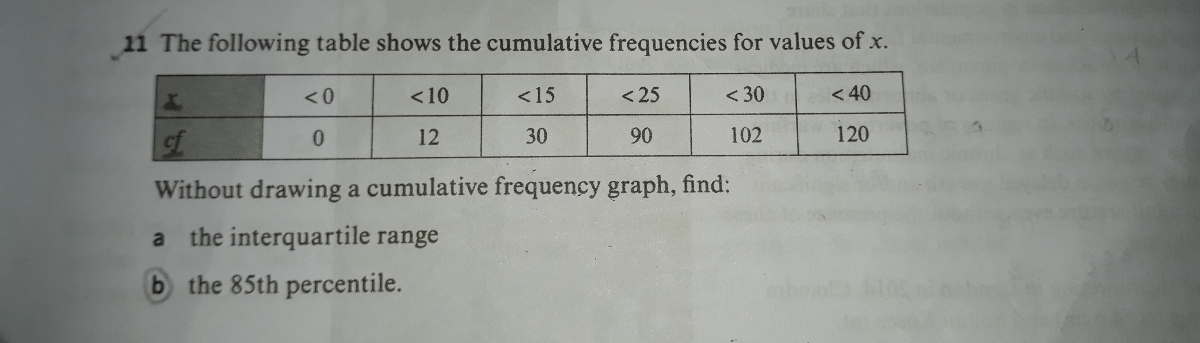

Transcribed Image Text:11 The following table shows the cumulative frequencies for values of x.
<0
<10
<15
< 25
< 30
< 40
120
of
90
0.
12
30
102
Without drawing a cumulative frequency graph, find:
a
the interquartile range
b the 85th percentile.

Transcribed Image Text:11 а 10
a Points plotted at (0, 0), (4, 2), (11,
b 30
12
Expert Solution
This question has been solved!
Explore an expertly crafted, step-by-step solution for a thorough understanding of key concepts.

This is a popular solution

Trending nowThis is a popular solution!

Step by stepSolved in 3 steps with 13 images

Knowledge Booster

Similar questions
- Use the Histogram tool to develop a frequency distribution and histogram for the number of months as a customer of the bank in the data below. Compute the relative and cumulative relative frequencies and use a line chart to construct an ogive. Complete the frequency distribution for the months as a customer, and compute the relative and cumulative relative frequencies. (Type integers or decimals rounded to three decimal places as needed.) Bins Frequency Relative Frequency Cumulative Relative Frequency 10 enter your response here enter your response here enter your response here 20 enter your response here enter your response here enter your response here 30 enter your response here enter your response here enter your response here 40 enter your response here enter your response here enter your response here 50 enter your response here enter your response here enter your…arrow_forwardHow to construct the frequency distributions? Write down the steps.arrow_forwardThe times taken in seconds by a group of students to complete an online exercise are listed as follows. 31,34,41,33,29,31,39,35,30,40 (a) Find the median time. (b) Calculate the interquartile range.arrow_forward
- The data represent the time, in minutes, spent reading a political blog in a day. Construct a frequency distribution using 5 classes. In the table, include the midpoints, relative frequencies, and cumulative frequencies. Which class has the greatest frequency and which has the least frequency? 15 14 4 7 19 12 16 5. 10 17 17 18 14 10 6 Complete the table, starting with the lowest class limit. (Simplify your answers.) Relative Cumulative Class Frequency Midpoint Frequency Frequency Which class has the greatest frequency? The class with the greatest frequency is from to Which class has the least frequency? The class with the least frequency from toarrow_forwardA set includes the following five numbers: 20,19,50,18,16 which data measure decreases when the outlier is not included in the calculationsarrow_forwardThe data represent the time, in minutes, spent reading a political blog in a day. Construct a frequency distribution using 5 dlassos. In the table, include the midpoints, relative frequencies, and cumulative frequencies. Which class has the greatest frequency and which has the least frequency? 4. 38 42 25 46 49 48 21 34 9 35 38 8. 47 3. 29 32 26 Complete the table, starting with the lowest class limit. (Simplify your answers.) Relative Cumulative Class Frequency Midpoint Frequency Frequency Which class has the greatest frequency? The class with the greatest frequency is from to. Which class has the least frequency? The class with the least frequency is from toarrow_forward
arrow_back_ios
arrow_forward_ios
Recommended textbooks for you
- A First Course in Probability (10th Edition)ProbabilityISBN:9780134753119Author:Sheldon RossPublisher:PEARSON

A First Course in Probability (10th Edition)
Probability
ISBN:9780134753119
Author:Sheldon Ross
Publisher:PEARSON