
MATLAB: An Introduction with Applications
6th Edition
ISBN: 9781119256830
Author: Amos Gilat
Publisher: John Wiley & Sons Inc
expand_more
expand_more
format_list_bulleted
Related questions
Topic Video
Question
Please help
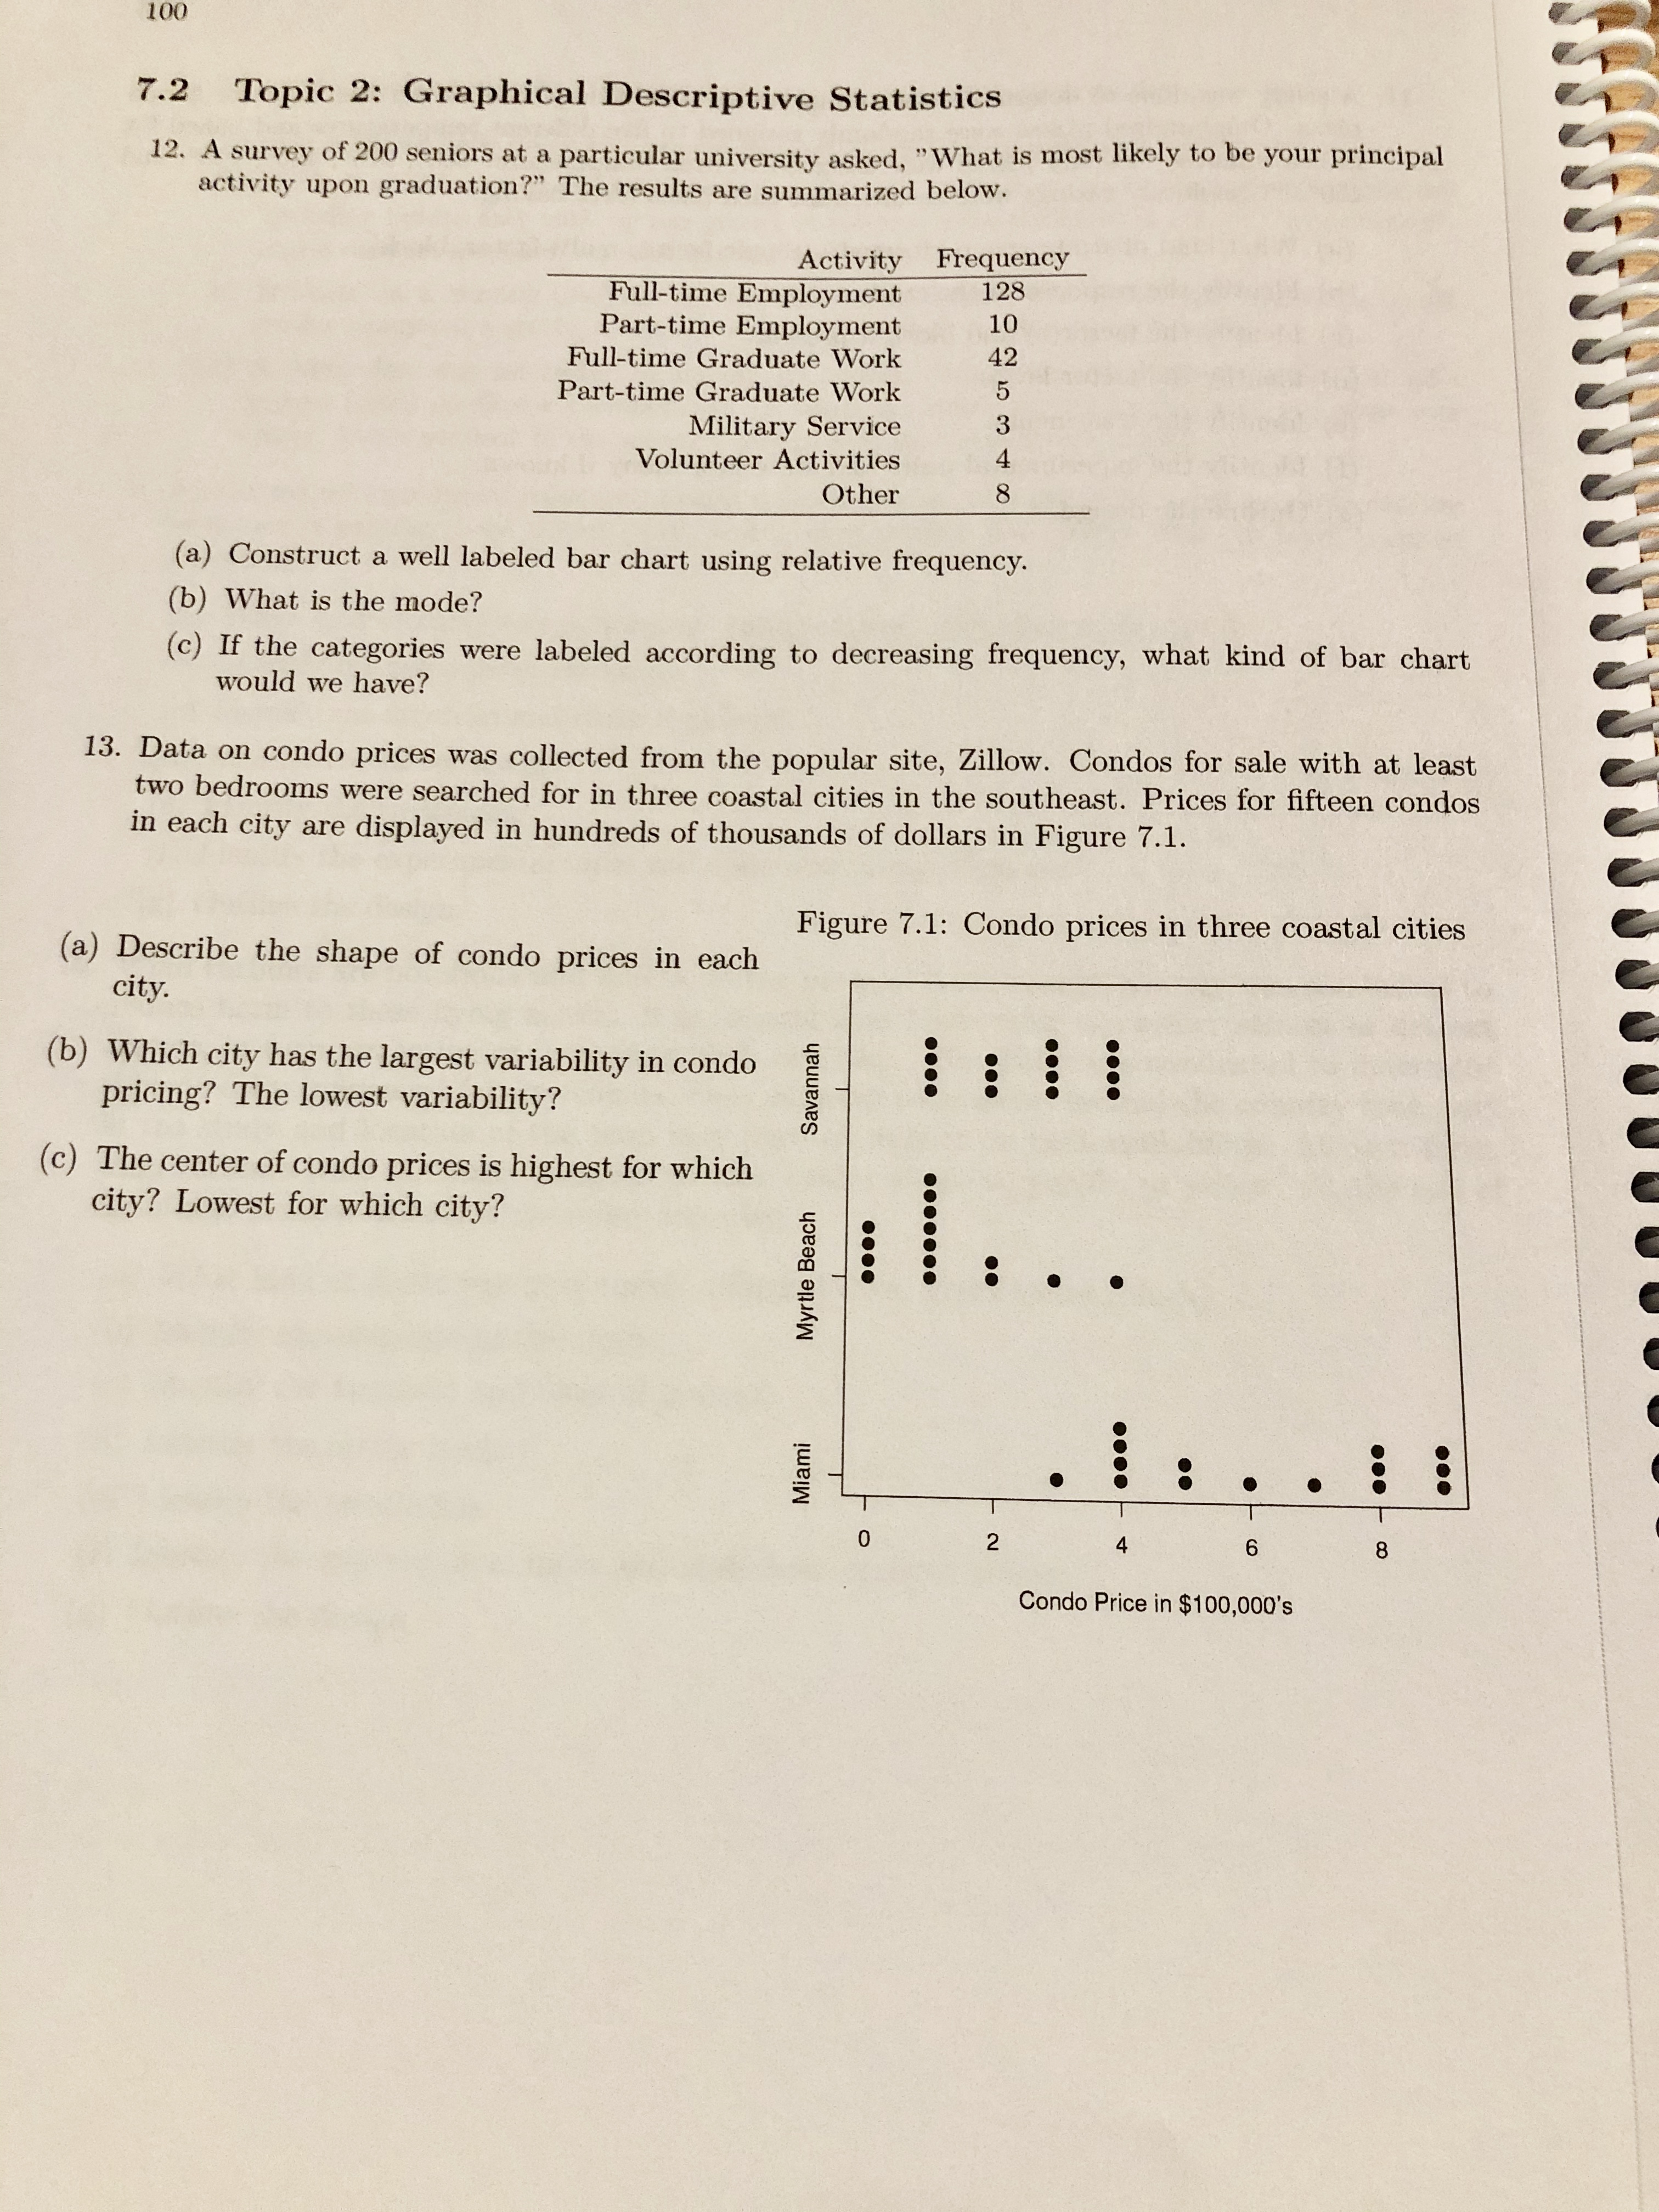

Transcribed Image Text:100
Topic 2: Graphical Descriptive Statistics
7.2
12. A survey of 200 seniors at a particular university asked, "What is most likely to be your principal
activity upon graduation?" The results are summarized below.
Activity Frequency
128
Full-time Employment
Part-time Employment
Full-time Graduate Work
10
42
Part-time Graduate Work
Military Service
Volunteer Activities
4
Other
8.
(a) Construct a well labeled bar chart using relative frequency.
(b) What is the mode?
(c) If the categories were labeled according to decreasing frequency, what kind of bar chart
would we have?
13. Data on condo prices was collected from the popular site, Zillow. Condos for sale with at least
two bedrooms were searched for in three coastal cities in the southeast. Prices for fifteen condos
in each city are displayed in hundreds of thousands of dollars in Figure 7.1.
Figure 7.1: Condo prices in three coastal cities
(a) Describe the shape of condo prices in each
city.
(b) Which city has the largest variability in condo
pricing? The lowest variability?
(c) The center of condo prices is highest for which
city? Lowest for which city?
1..
1..
4
6.
8
Condo Price in $100,000's
Miami
Myrtle Beach
Savannah
000000.
2.
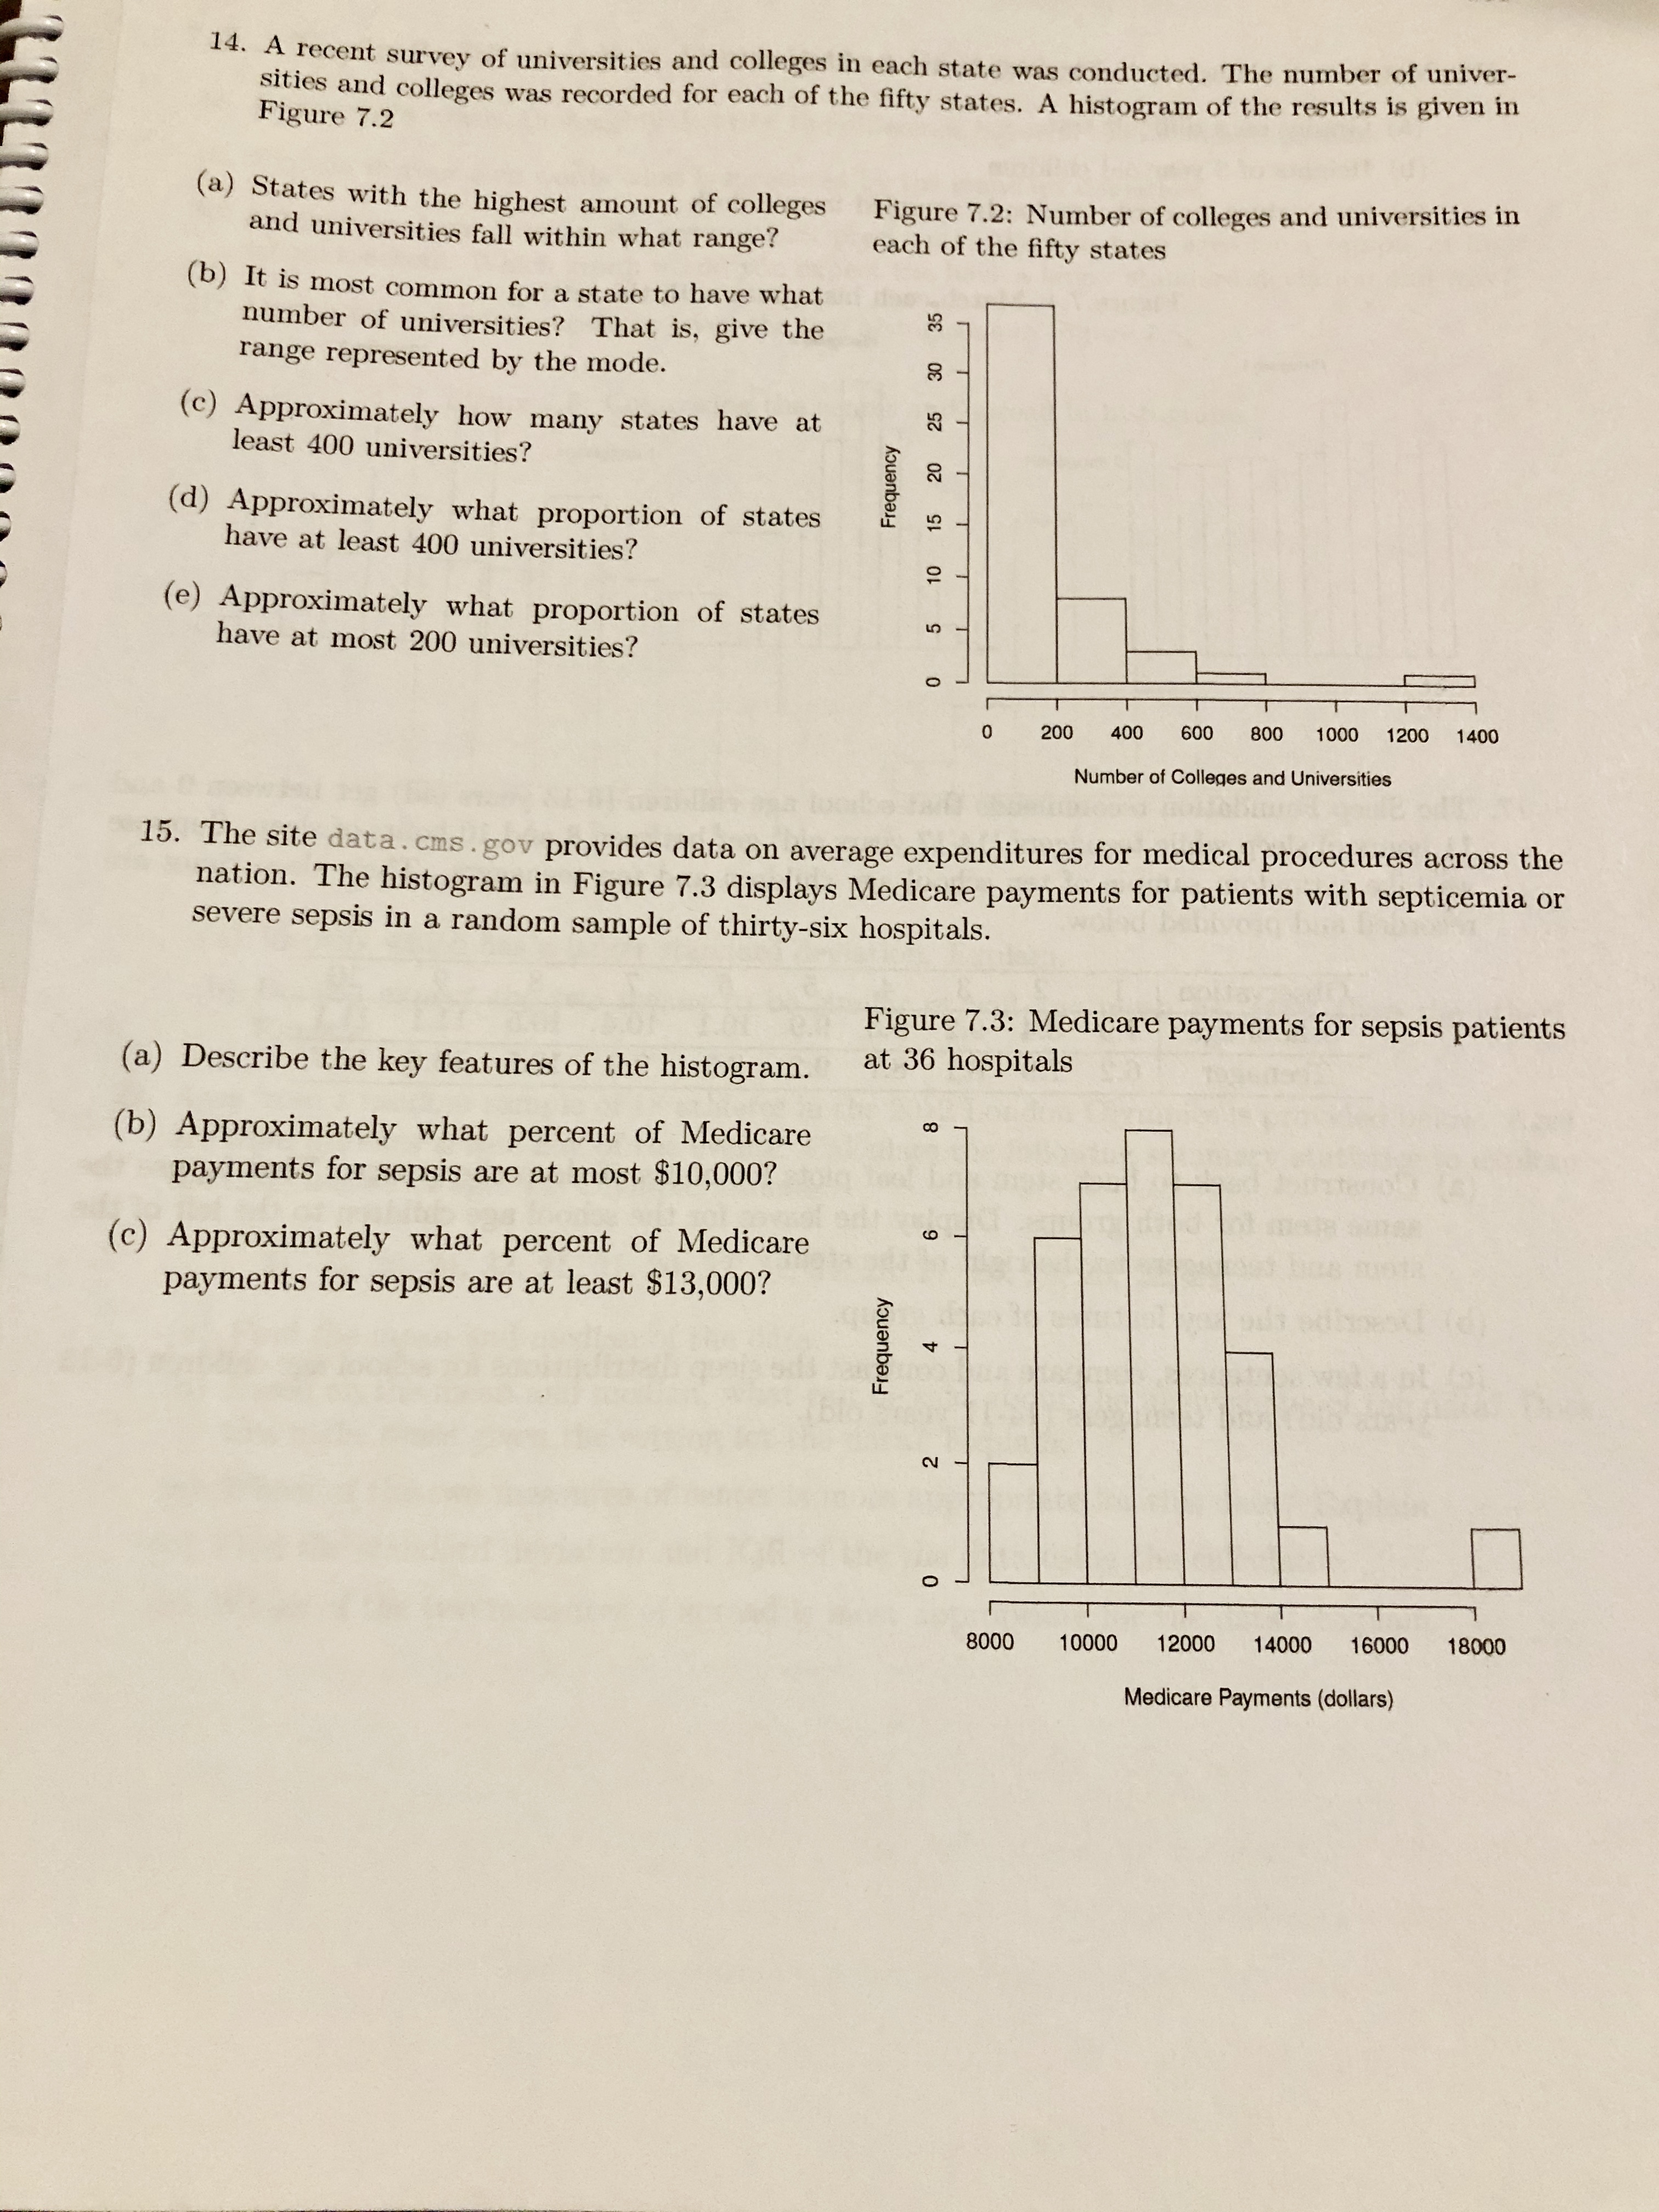
Transcribed Image Text:14. A recent survey of universities and colleges in each state was conducted. The number of univer-
sities and colleges was recorded for each of the fifty states. A histogram of the results is given in
Figure 7.2
(a) States with the highest amount of colleges
and universities fall within what range?
Figure 7.2: Number of colleges and universities in
each of the fifty states
(b) It is most common for a state to have what
number of universities? That is, give the
range represented by the mode.
(c) Approximately how many states have at
least 400 uiversities?
25
(d) Approximately what proportion of states
have at least 400 universities?
10
(e) Approximately what proportion of states
have at most 200 universities?
1000
1200
1400
600
800
400
200
Number of Colleges and Universities
15. The site data.cms.gov provides data on average expenditures for medical procedures across the
nation. The histogram in Figure 7.3 displays Medicare payments for patients with septicemia or
severe sepsis in a random sample of thirty-six hospitals.
Figure 7.3: Medicare payments for sepsis patients
at 36 hospitals
(a) Describe the key features of the histogram.
(b) Approximately what percent of Medicare
payments for sepsis are at most $10,000?
(c) Approximately what percent of Medicare
payments for sepsis are at least $13,000?
14000
18000
16000
12000
10000
8000
Medicare Payments (dollars)
Frequency
Frequency
2
5
15
20
35
4.
9.
Expert Solution
This question has been solved!
Explore an expertly crafted, step-by-step solution for a thorough understanding of key concepts.

This is a popular solution

Trending nowThis is a popular solution!

Step by stepSolved in 3 steps with 2 images

Knowledge Booster


Learn more about
Need a deep-dive on the concept behind this application? Look no further. Learn more about this topic, statistics and related others by exploring similar questions and additional content below.Similar questions
arrow_back_ios
SEE MORE QUESTIONS
arrow_forward_ios
Recommended textbooks for you
- MATLAB: An Introduction with ApplicationsStatisticsISBN:9781119256830Author:Amos GilatPublisher:John Wiley & Sons Inc
 Probability and Statistics for Engineering and th...StatisticsISBN:9781305251809Author:Jay L. DevorePublisher:Cengage Learning
 Statistics for The Behavioral Sciences (MindTap C...StatisticsISBN:9781305504912Author:Frederick J Gravetter, Larry B. WallnauPublisher:Cengage Learning
  Elementary Statistics: Picturing the World (7th E...StatisticsISBN:9780134683416Author:Ron Larson, Betsy FarberPublisher:PEARSON
 The Basic Practice of StatisticsStatisticsISBN:9781319042578Author:David S. Moore, William I. Notz, Michael A. FlignerPublisher:W. H. Freeman
 Introduction to the Practice of StatisticsStatisticsISBN:9781319013387Author:David S. Moore, George P. McCabe, Bruce A. CraigPublisher:W. H. Freeman
MATLAB: An Introduction with Applications
Statistics
ISBN:9781119256830
Author:Amos Gilat
Publisher:John Wiley & Sons Inc
Probability and Statistics for Engineering and th...
Statistics
ISBN:9781305251809
Author:Jay L. Devore
Publisher:Cengage Learning
Statistics for The Behavioral Sciences (MindTap C...
Statistics
ISBN:9781305504912
Author:Frederick J Gravetter, Larry B. Wallnau
Publisher:Cengage Learning
Elementary Statistics: Picturing the World (7th E...
Statistics
ISBN:9780134683416
Author:Ron Larson, Betsy Farber
Publisher:PEARSON
The Basic Practice of Statistics
Statistics
ISBN:9781319042578
Author:David S. Moore, William I. Notz, Michael A. Fligner
Publisher:W. H. Freeman
Introduction to the Practice of Statistics
Statistics
ISBN:9781319013387
Author:David S. Moore, George P. McCabe, Bruce A. Craig
Publisher:W. H. Freeman