Question
thumb_up100%

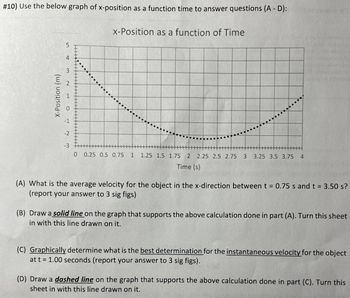
Transcribed Image Text:#10) Use the below graph of x-position as a function time to answer questions (A - D):
X-Position (m)
5
4
3
-1
-2
-3
x-Position as a function of Time
0 0.25 0.5 0.75 1 1.25 1.5 1.75 2 2.25 2.5 2.75 3 3.25 3.5 3.75 4
Time (s)
(A) What is the average velocity for the object in the x-direction between t = 0.75 s and t = 3.50 s?
(report your answer to 3 sig figs)
(B) Draw a solid line on the graph that supports the above calculation done in part (A). Turn this sheet
in with this line drawn on it.
(C) Graphically determine what is the best determination for the instantaneous velocity for the object
at t = 1.00 seconds (report your answer to 3 sig figs).
(D) Draw a dashed line on the graph that supports the above calculation done in part (C). Turn this
sheet in with this line drawn on it.
Expert Solution
This question has been solved!
Explore an expertly crafted, step-by-step solution for a thorough understanding of key concepts.
Step by stepSolved in 2 steps with 1 images

Knowledge Booster
Similar questions
- A race car moves such that its position fits the relationship x-(4.5 m/s)t + (0.80 m/s³³ where x is measured in meters and in seconds. (a) A plot of the car's position versus time is which of the following? برسا 100- O x(m) 90 80 70 60 30 30 20 10 O x(m) 240 220 200 180 160 140 1201 100 80 60 200 180 160 140 120 EL 100 80 40 20 t(s) 40 1.00 2.00 20 t(s) 3.00 4.00 5.00 6.00 1.00 2.00 3.00 4.00 5.00 x(m) 6.00 30 25 20 15 10 5 x(m) t(s) 1.00 2.00 3.00 4.00 5.00 6.00 220 t(s) 1.00 2.00 3.00 4.00 5.00 6.00 (b) Determine the instantaneous velocity of the car at t-4.4 s, using time intervals of 0.40 s, 0.20 s, and 0.10 s. (In order to better see the limiting process keep at least three decimal places in your answer.) At-0.40 s m/s (Use the interval from t-4.20 sto 4.60 s.) At -0.20 s m/s (Use the interval from t-4.30 sto 4.50 s.) At - 0.10 s m/s (Use the interval from t-4.35 sto 4.45 s.) (c) Compare the average velocity during the first 4.4 s with the results of part (b). The average velocity…arrow_forward2- A) Estimate how long it took King Kong to fall straight down from the top of the building (475 mm high). Express your answer to three significant figures and include the appropriate units. B) Estimate his speed just before "landing."arrow_forwardThe following equations give the x component of the position for four objects as functions of time: object 1: x(t) = a, where a = 5 m object 2: x(t) = bt+c, where b = +4 m/s and c = : −1 m object 3: x(t) = et² + ft, where e = +5 m/s² and f = -9 m/s object 4: x(t) = gt² + h, where g = −3 m/s² and h = +12 m. (a) Which objects have a velocity that changes with time? (b) Which object is at the origin at the earliest instant, and what is that instant? (c) What is that object's velocity 1 s after the instant you calculated in part b?arrow_forward
- A graph of position versus time for a certain particle moving along the x-axis is shown in the figure below. Find the average velocity in the following time intervals. x (m) 10 8 1000049 2 M 1 2 3 4 5 6 7/8 (d) 4.00 s to 7.00 s m/s (e) 0 to 8.00 s m/sarrow_forward4. Consider path B in the figure to the right. What is (a) the distance traveled? (b) the A B C displacement? e D 0 2 4 6 8 10 12 displacement x (m)arrow_forward7) A cyclist moves at 11.0 m/s for 1.00 min and at 16.0 m/s for 2.00 min. Find the average velocity if the second part of the motion is (a) in the same direction as the first (hint, the answer is not 13.5 m/s), and (b) in the opposite direction.arrow_forward
- 3. (a) The value of vx is still positive and decreases marginally over time. (b) The value of vx is changed from positive to negative over time. (c) The value of vx is always negative and increases only slowly over time. (d) The value of vx is still positive and constant over time. (e) The value of vx is changed from negative to positive over time.arrow_forwardThe graph of velocity function v(t) is given below. n 05 Which of the following could be the graph of a (t)? O O O 10 -0.5 -10 10 05 10 A 05 -10 10 f 05arrow_forward14) In the following velocity vs. time graph, what is the displacement between 10 and 15 seconds? velocity (m/min) 80 60 40 20 time (min) - 20 40 10 20 40 50 57 N at 30° CCW E = 30arrow_forward
arrow_back_ios
arrow_forward_ios