
MATLAB: An Introduction with Applications
6th Edition
ISBN: 9781119256830
Author: Amos Gilat
Publisher: John Wiley & Sons Inc
expand_more
expand_more
format_list_bulleted
Related questions
Question
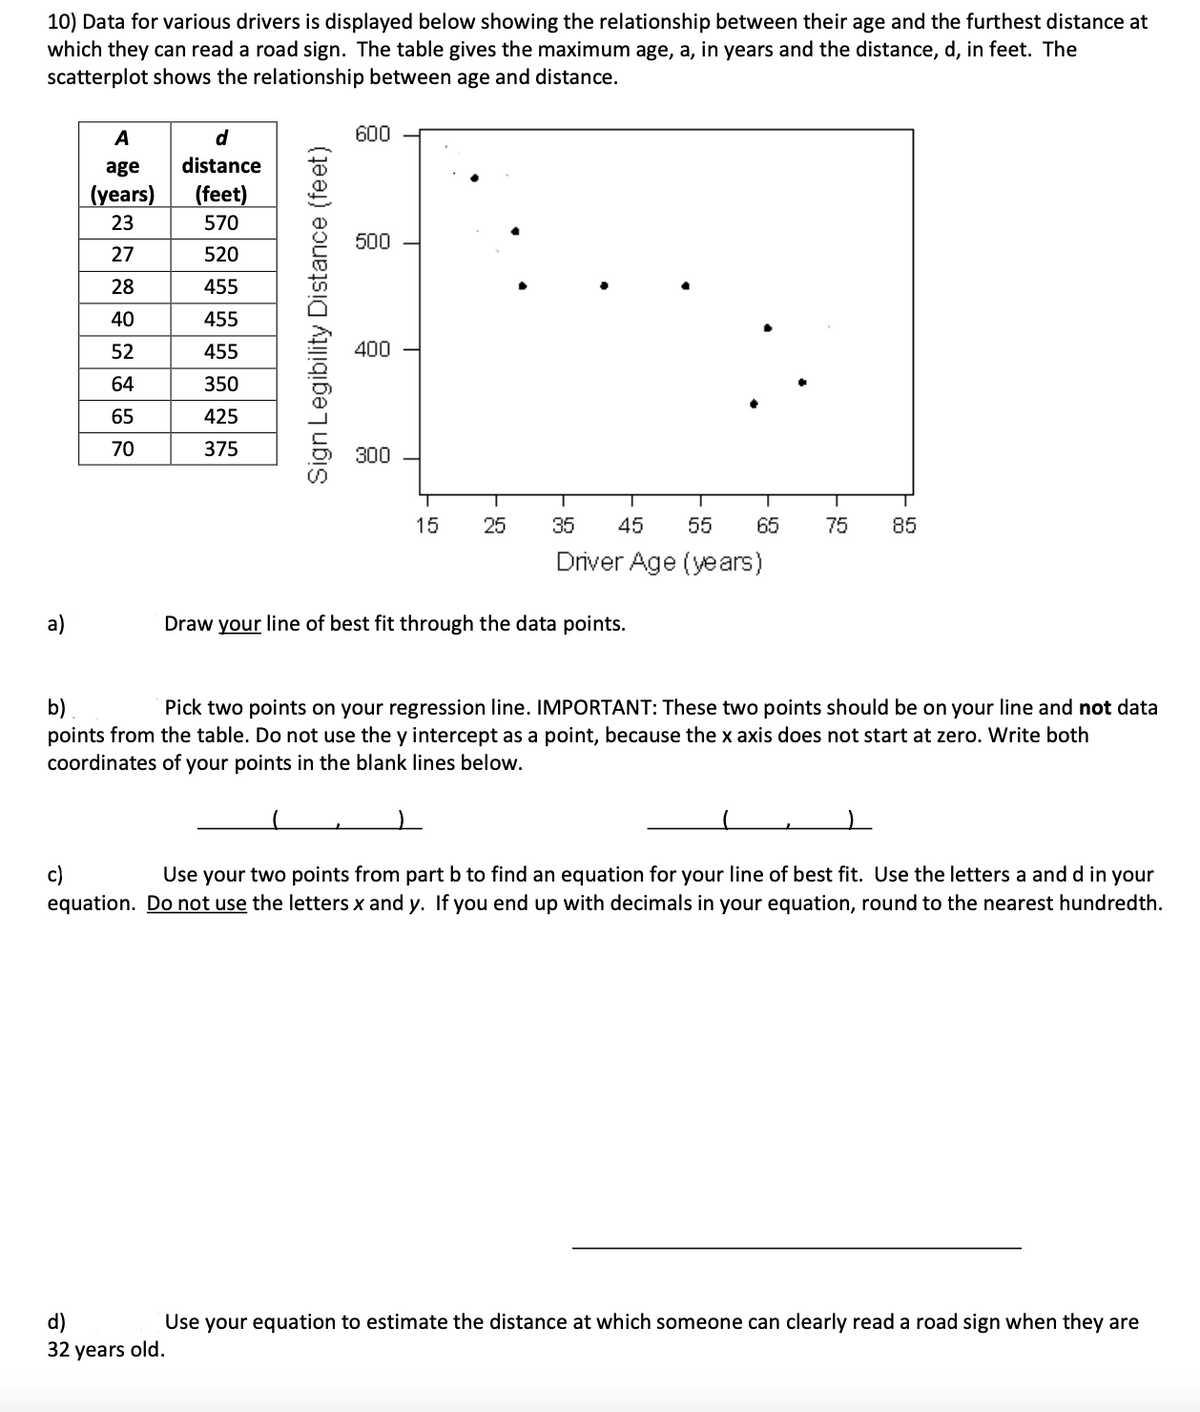

Transcribed Image Text:10) Data for various drivers is displayed below showing the relationship between their age and the furthest distance at
which they can read a road sign. The table gives the maximum age, a, in years and the distance, d, in feet. The
scatterplot shows the relationship between age and distance.
a)
A
d
age
distance
(years) (feet)
23
570
27
520
28
455
40
455
52
455
64
350
65
425
70
375
Sign Legibility Distance (feet)
600
500
400
300
T
15
25
35 45 55 65
Driver Age (years)
Draw your line of best fit through the data points.
75
85
b)
Pick two points on your regression line. IMPORTANT: These two points should be on your line and not data
points from the table. Do not use the y intercept as a point, because the x axis does not start at zero. Write both
coordinates of your points in the blank lines below.
c)
Use your two points from part b to find an equation for your line of best fit. Use the letters a and d in your
equation. Do not use the letters x and y. If you end up with decimals in your equation, round to the nearest hundredth.
d)
Use your equation to estimate the distance at which someone can clearly read a road sign when they are
32 years old.
Expert Solution
This question has been solved!
Explore an expertly crafted, step-by-step solution for a thorough understanding of key concepts.

This is a popular solution

Trending nowThis is a popular solution!

Step by stepSolved in 4 steps with 1 images

Knowledge Booster

Similar questions
- The following data gives the number of hours 5 students spent studying and their corresponding grades on their midterm exams. Hours Spent Studying 1 3 4 5 6. Midterm Grades 69 81 87 90 96 Copy Data Draw a scatter plot of the given data. 国 Tables E Keypad Answer Keyboard Shortcuts Select a location in the chart to plot a point. Points can be moved by dragging or using the arrow keys. Select the Clear button to remove all points. 99 - 96 - 93 - 90 - 87 - 84 - 81 - 78 Clear 75 - 72 - 69 - 66 - 63 - 60 + 6 Hours Spent Studying Midterm Gradesarrow_forwardThe final letter grades earned on a mathematies course are given in the table below. A B C D F W 12 20 10 4 Use a pie chart to represent this data. Write down the work leading to your answer. The last page has a protractor which you may print and use.arrow_forwardGive me an explanation of what is taught by the chart ?arrow_forward
- The following table shows the length, in centimeters, of the humerus and the total wingspan, in centimeters, of several pterosaurs, which are extinct flying reptiles. (A graphing calculator is recommended.) Pterosaur Data Humerus, x Wingspan, y Humerus, x Wingspan, y 27 576 32 589 33 605 35 745 25 559 24 552 23 472 22 461 18 411 17 410 1.5 36 1.4 30 1.3 29 0.9 28 0.8 24 (a) Find the equation of the least-squares regression line for the data. Round constants to the nearest hundredth. (b) Use the equation from part (a) to determine, to the nearest centimeter, the projected wingspan of a pterosaur if its humerus is 56 centimeters. cmarrow_forward2.A Please help me with the solution and answer( this is for my reviewer only) thank youarrow_forward
arrow_back_ios
arrow_forward_ios
Recommended textbooks for you
- MATLAB: An Introduction with ApplicationsStatisticsISBN:9781119256830Author:Amos GilatPublisher:John Wiley & Sons Inc
 Probability and Statistics for Engineering and th...StatisticsISBN:9781305251809Author:Jay L. DevorePublisher:Cengage Learning
 Statistics for The Behavioral Sciences (MindTap C...StatisticsISBN:9781305504912Author:Frederick J Gravetter, Larry B. WallnauPublisher:Cengage Learning
  Elementary Statistics: Picturing the World (7th E...StatisticsISBN:9780134683416Author:Ron Larson, Betsy FarberPublisher:PEARSON
 The Basic Practice of StatisticsStatisticsISBN:9781319042578Author:David S. Moore, William I. Notz, Michael A. FlignerPublisher:W. H. Freeman
 Introduction to the Practice of StatisticsStatisticsISBN:9781319013387Author:David S. Moore, George P. McCabe, Bruce A. CraigPublisher:W. H. Freeman
MATLAB: An Introduction with Applications
Statistics
ISBN:9781119256830
Author:Amos Gilat
Publisher:John Wiley & Sons Inc
Probability and Statistics for Engineering and th...
Statistics
ISBN:9781305251809
Author:Jay L. Devore
Publisher:Cengage Learning
Statistics for The Behavioral Sciences (MindTap C...
Statistics
ISBN:9781305504912
Author:Frederick J Gravetter, Larry B. Wallnau
Publisher:Cengage Learning
Elementary Statistics: Picturing the World (7th E...
Statistics
ISBN:9780134683416
Author:Ron Larson, Betsy Farber
Publisher:PEARSON
The Basic Practice of Statistics
Statistics
ISBN:9781319042578
Author:David S. Moore, William I. Notz, Michael A. Fligner
Publisher:W. H. Freeman
Introduction to the Practice of Statistics
Statistics
ISBN:9781319013387
Author:David S. Moore, George P. McCabe, Bruce A. Craig
Publisher:W. H. Freeman