
Algebra and Trigonometry (6th Edition)
6th Edition
ISBN: 9780134463216
Author: Robert F. Blitzer
Publisher: PEARSON
expand_more
expand_more
format_list_bulleted
Related questions
Question

Transcribed Image Text:**Transcription and Analysis for Educational Website**
---
**Task:**
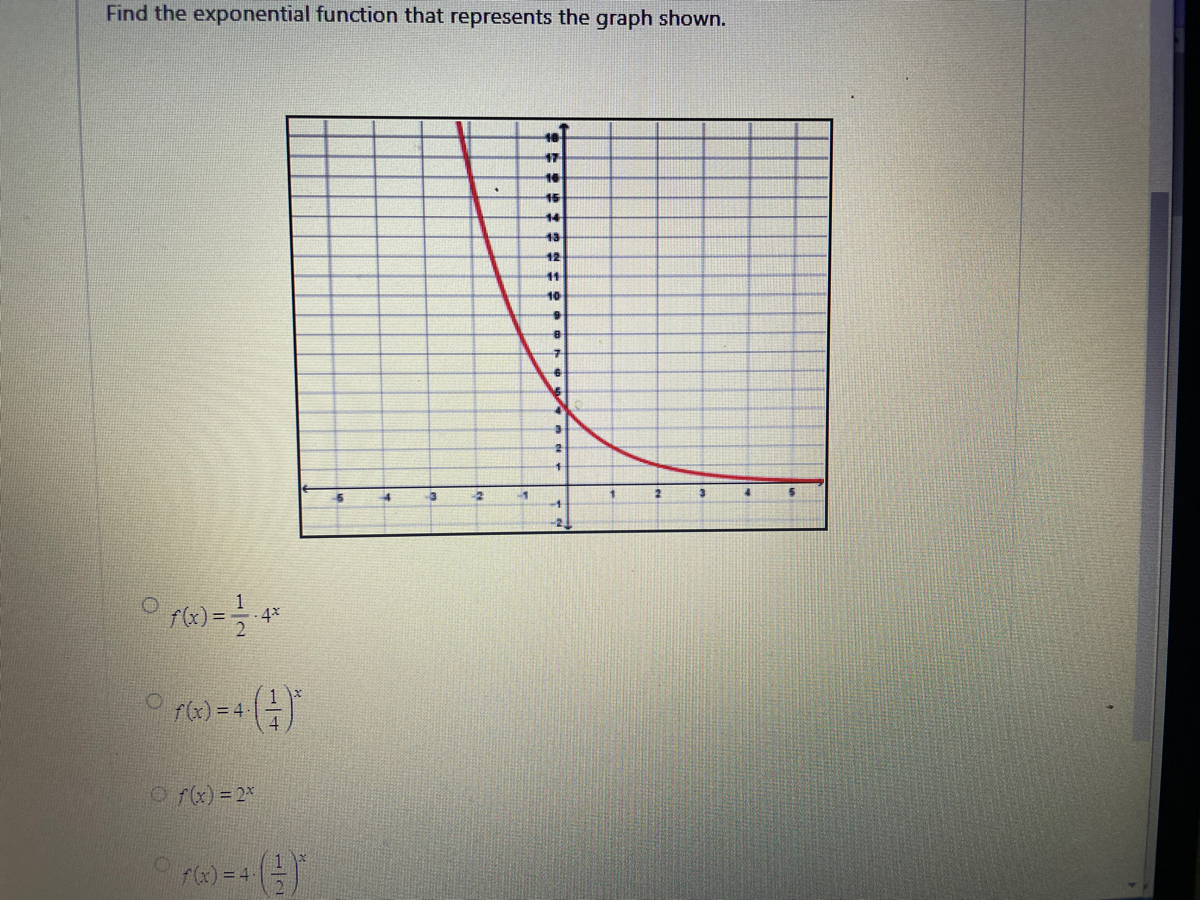
Find the exponential function that represents the graph shown.
**Graph Description:**
The graph presented is a downward-sloping exponential curve, starting from high positive values on the left and approaching zero as it moves to the right. The x-axis ranges from -5 to 5, and the y-axis ranges from -2 to 18. The red curve demonstrates exponential decay.
**Multiple-Choice Options:**
1. \( f(x) = \frac{1}{2} \cdot 4^x \)
2. \( f(x) = 4 \left( \frac{1}{4} \right)^x \)
3. \( f(x) = 2^x \)
4. \( f(x) = 4 \left( \frac{1}{2} \right)^x \)
**Explanation of the Graph:**
- The graph shows exponential decay, typically characterized by a function where the base of the exponent is between 0 and 1.
- The behavior of the graph suggests it matches one of the given functions based on its asymptotic trend towards the x-axis.
**Conclusion:**
Analyze the functions to determine which one represents the graph accurately. Functions with a base of less than 1 in the exponent will show decay, similar to the red curve in the graph.
Expert Solution
arrow_forward
Step 1
Topic = Function
Correct option

Step by stepSolved in 2 steps

Knowledge Booster

Similar questions
- 1 3 4. 16 11. Perform the indicated operation of the composition of functions. h(x) = -2x² – 5 g(x) = 2x – 1 Find (h o g)(x) a. Sx) = -x² + 3 g(x) = 3x + 4 Find (f g)(x) b. %3Darrow_forward1. Describe how the graph of the function can be obtained from one of the basic graphs: 1 y = x y = 22 y = VI y = r3 y = VI y y = |r| (a) f(x) = (x+ 3)² (b) f(r) = x2 +3 (c) f(x) = 12 - %3D (d) h(x) = -VI (e) h(x) = V- 1 (f) g(x) = 1 (g) g(x) = (h) g(x) = |x+2| – 3 (i) f(x) = VI + 2 (6) f(x) =D -글V-1 (k) f(r) = 2VT– 4 (1) f(r) = 2V - 4 4 (m) f(r) = . 2 (n) f(x) = 5 - (0) f(x) %3D 옮교3-4 (p) g(x) = -(x – 3)2 + 5 4.arrow_forward3. A bird population can be modeled by f (x) = x3 – 66x + 1052x + 1652 where x = 1 corresponds to June 1, x = 2 to June 2 and so on. Find the days when f estimates that there were 3500 birds.arrow_forward
Recommended textbooks for you
- Algebra and Trigonometry (6th Edition)AlgebraISBN:9780134463216Author:Robert F. BlitzerPublisher:PEARSON
 Contemporary Abstract AlgebraAlgebraISBN:9781305657960Author:Joseph GallianPublisher:Cengage Learning
 Linear Algebra: A Modern IntroductionAlgebraISBN:9781285463247Author:David PoolePublisher:Cengage Learning
  Algebra And Trigonometry (11th Edition)AlgebraISBN:9780135163078Author:Michael SullivanPublisher:PEARSON
 Introduction to Linear Algebra, Fifth EditionAlgebraISBN:9780980232776Author:Gilbert StrangPublisher:Wellesley-Cambridge Press
 College Algebra (Collegiate Math)AlgebraISBN:9780077836344Author:Julie Miller, Donna GerkenPublisher:McGraw-Hill Education
Algebra and Trigonometry (6th Edition)
Algebra
ISBN:9780134463216
Author:Robert F. Blitzer
Publisher:PEARSON
Contemporary Abstract Algebra
Algebra
ISBN:9781305657960
Author:Joseph Gallian
Publisher:Cengage Learning
Linear Algebra: A Modern Introduction
Algebra
ISBN:9781285463247
Author:David Poole
Publisher:Cengage Learning
Algebra And Trigonometry (11th Edition)
Algebra
ISBN:9780135163078
Author:Michael Sullivan
Publisher:PEARSON
Introduction to Linear Algebra, Fifth Edition
Algebra
ISBN:9780980232776
Author:Gilbert Strang
Publisher:Wellesley-Cambridge Press
College Algebra (Collegiate Math)
Algebra
ISBN:9780077836344
Author:Julie Miller, Donna Gerken
Publisher:McGraw-Hill Education