Question
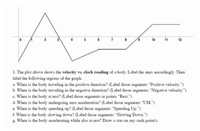
The plot above shows the velocity vs. clock reading of a body. Label the axes accordingly. Then
label the following regions of the graph

Transcribed Image Text:10
12
1. The plot above shows the velocity vs. elock reading of a body. Label the axes accordingly. Then
label the following regions of the graph.
a. When is the body traveling in the positive direction? (Label those segments "Positive velocity.")
b. When is the body traveling in the negative direction? (Label those segments "Negative velocity.")
e. When is the body at rest? (Label those segments or points "Rest.")
d. When is the body undergoing zero acceleration? (Label those segments "UM.")
e. When is the body speeding up? (Label those segments "Speeding Up.")
£. When is the body slowing down? (Label those segments "Slowing Down.")
g. When is the body accelerating while also at rest? Draw a star on any such point/s.
Expert Solution
This question has been solved!
Explore an expertly crafted, step-by-step solution for a thorough understanding of key concepts.
This is a popular solution
Trending nowThis is a popular solution!
Step by stepSolved in 2 steps with 1 images

Knowledge Booster
Similar questions
- What is uniform velocity motion at zero? Explain.arrow_forwardLet discuss the motion of an object that is represented by the following equation. Describe what do you think about the situations.arrow_forwardIn what reasonable ways can you represent or describe the motion of a car traveling from one stoplight to the next? Construct each representation for the moving car.arrow_forward
- what is the the symbol of velocityarrow_forwardYou measure the acceleration of a METRA train to be a = 0.58 m/s/s. If you are standing at the front car when the train pulls away, how fast is the train moving after 3 cars pass you? Give your answer in miles per hour (to the nearest whole number). NOTES: Each METRA car is 25.9 meters in length. 1 m/s = 2.24 miles per hourarrow_forwardplease send correct answerarrow_forward
- A basketball rolls away from you with a constant speed until hit hits a large bump at the end of your driveway. The ball rolls up the bump only under the influence of gravity, then stops for a split second, then rolls down the other side of the bump. [motion away from you is positive motion). Which veloctiy vs. time graph best shows the motion of the ball as it rolls? a. V O b. v O c. v O d. v e. varrow_forwardwhat is the correct equation for this objectarrow_forwardUse the following information to answer parts a and b. A motorboat is travelling at its maximum speed of 6.0 m s⁻¹ straight across a river, which has a current of 3.8 m s⁻¹ downstream, as shown in the diagram The banks of the river are parallel to each other and straight. a) Calculate the velocity of the boat as seen by someone at the position marked ‘A’ on the diagram. b) If the river is 1100m wide, how long does it take for the boat to reach the other bank?arrow_forward
- The black dot in the diagram below is moving along the positive x-axis. Its position has been plotted after every 10 seconds on a scale, as shown below. What graphs best represent the object’s velocity as a function of time?arrow_forwardPhysics question Chapter : Motion show step by step for question A & Barrow_forwardThe diagram at right shows the position versus time graph for a car moving in a straight line. Describe in your own words what you would see the speedometer needle doing during the various phases of the motion: from 0 to A, from A to B, and from B to С.arrow_forward
arrow_back_ios
SEE MORE QUESTIONS
arrow_forward_ios