
MATLAB: An Introduction with Applications
6th Edition
ISBN: 9781119256830
Author: Amos Gilat
Publisher: John Wiley & Sons Inc
expand_more
expand_more
format_list_bulleted
Related questions
Concept explainers
Topic Video
Question
1.Using the
2.Face Mask
Julia is a boutique shop owner in her town. Due to COVID-19 pandemic, wearing a face mask of a person is required for their safety. Since there are limited stocks available, she decided to starta anotherbusiness by making a face mask. She started selling face masks from day 1 to day 10. The datas shecollected is shown in the table below.Illustrate a probability distribution of a random variable X showing the number of face masks soldper day and its corresponding probabilities.
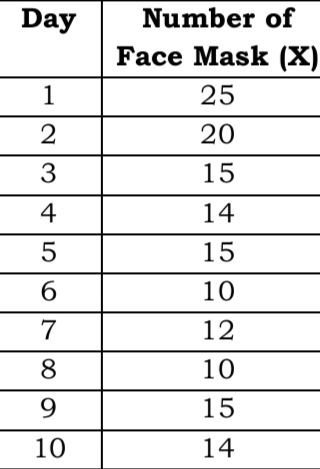

Transcribed Image Text:Day
Number of
Face Mask (X)
1
25
2
20
15
4
14
5
15
б
10
12
8
10
9
15
10
14
Expert Solution
This question has been solved!
Explore an expertly crafted, step-by-step solution for a thorough understanding of key concepts.

Step by stepSolved in 4 steps with 2 images

Knowledge Booster


Learn more about
Need a deep-dive on the concept behind this application? Look no further. Learn more about this topic, statistics and related others by exploring similar questions and additional content below.Similar questions
- After careful research you observe that the number of hackers active on each day is a random variable Bin(3,0.5) distribution. If no hackers are active, the probability of the website failure is 0.15; If one hacker is active the probability of the website failure is 0.3; if two or more hackers are active the probability of the website failure is 0.5. You conclude that the total probability of website failure on a given day is two decimal place). Assuming there is a failure, the probability no hackers are active is (to (to two decimal places).arrow_forwardTwo tetrahedral dice, each with faces labelled 1, 2, 3 and 4, are thrown and the random variable X represents the sum of the numbers shown on the dice. li) Find the probability distribution of X. (ii) Illustrate the distribution and describe the shape of the distribution. (iii) What is the probability that any throw of the dice results in a value of X which is an odd number?arrow_forwardA game is played by throwing 3 dice. You will win in this game if the summation of the score of these 3 dice is 3, 4, 17, 18. What is the variance of your expected values?arrow_forward
- 4. A large insurance company indicates that 78% of the policy holders have at least one health issues and 22% do not health issues. Let Y1 be a random variable defined as Yı = 0, if the policy holder does not have any health issues; Yı = 1, if the if the policy holder have health issues. Write the probability distribution of Y1, E(Y1) and Var(Y1).arrow_forwardInformation is provided for 3 different ways of getting from home to work in the morning. From A way: μA =34 minutes, 4-5.4 minutes; From B way: μ=31 minutes, 4-2 minutes; From C way: μ =32 minutes, 4-4 minutes. Which route should someone with 29 minutes of time take? Hint1. Define the commute time as a random variable X. Hint2. Use normal probability table. O a. B O b. A O c. Bor C O d. C O e. A or Barrow_forward2. Wallace figures his chances of getting a new car for graduation at 70% if he graduates as class valedictorian. He only has about a 25% chance of getting a new car if he graduates 2nd or lower. He estimates his chances of being valedictorian at 50/50. What is the likelihood that Wallace will get a new car?arrow_forward
- How is the probability distribution of a variable defined?arrow_forwardAnita's, a fast-food chain specializing in hot dogs and garlic fries, can monitor how many customers at its restaurants want to eat (in addition to ordering takeout) to decide whether or not to build a location to play in the city. . Including the presence of Sammy the mascot in local locations, stores and franchises, Anita reports that 45% of her customers order food for delivery. If this ratio is true, what is the probability that a random sample of 3 of Anita's 4 customers will order food? Round your response to at least three decimal places. (If necessary, consult a list of formulas.)arrow_forwardSuppose that more than a decade ago high levels of lead in the blood put 82% of children atrisk. A concerted effort was made to remove lead from the environment. Suppose, accordingto a survey, only 9% of children in the United States are at risk of high blood-lead levels. In arandom sample of 100 children taken more than a decade ago, what is the probability that 70or more had high blood-lead levels? Group of answer choices 0.867 0.839 1.000 0.000 0.117arrow_forward
arrow_back_ios
arrow_forward_ios
Recommended textbooks for you
- MATLAB: An Introduction with ApplicationsStatisticsISBN:9781119256830Author:Amos GilatPublisher:John Wiley & Sons Inc
 Probability and Statistics for Engineering and th...StatisticsISBN:9781305251809Author:Jay L. DevorePublisher:Cengage Learning
 Statistics for The Behavioral Sciences (MindTap C...StatisticsISBN:9781305504912Author:Frederick J Gravetter, Larry B. WallnauPublisher:Cengage Learning
  Elementary Statistics: Picturing the World (7th E...StatisticsISBN:9780134683416Author:Ron Larson, Betsy FarberPublisher:PEARSON
 The Basic Practice of StatisticsStatisticsISBN:9781319042578Author:David S. Moore, William I. Notz, Michael A. FlignerPublisher:W. H. Freeman
 Introduction to the Practice of StatisticsStatisticsISBN:9781319013387Author:David S. Moore, George P. McCabe, Bruce A. CraigPublisher:W. H. Freeman
MATLAB: An Introduction with Applications
Statistics
ISBN:9781119256830
Author:Amos Gilat
Publisher:John Wiley & Sons Inc
Probability and Statistics for Engineering and th...
Statistics
ISBN:9781305251809
Author:Jay L. Devore
Publisher:Cengage Learning
Statistics for The Behavioral Sciences (MindTap C...
Statistics
ISBN:9781305504912
Author:Frederick J Gravetter, Larry B. Wallnau
Publisher:Cengage Learning
Elementary Statistics: Picturing the World (7th E...
Statistics
ISBN:9780134683416
Author:Ron Larson, Betsy Farber
Publisher:PEARSON
The Basic Practice of Statistics
Statistics
ISBN:9781319042578
Author:David S. Moore, William I. Notz, Michael A. Fligner
Publisher:W. H. Freeman
Introduction to the Practice of Statistics
Statistics
ISBN:9781319013387
Author:David S. Moore, George P. McCabe, Bruce A. Craig
Publisher:W. H. Freeman