
MATLAB: An Introduction with Applications
6th Edition
ISBN: 9781119256830
Author: Amos Gilat
Publisher: John Wiley & Sons Inc
expand_more
expand_more
format_list_bulleted
Related questions
Question
1.) The expected return on Bob’s stock portfolio is _______ .
2.) Suppose each stock in the preceding portfolio has a
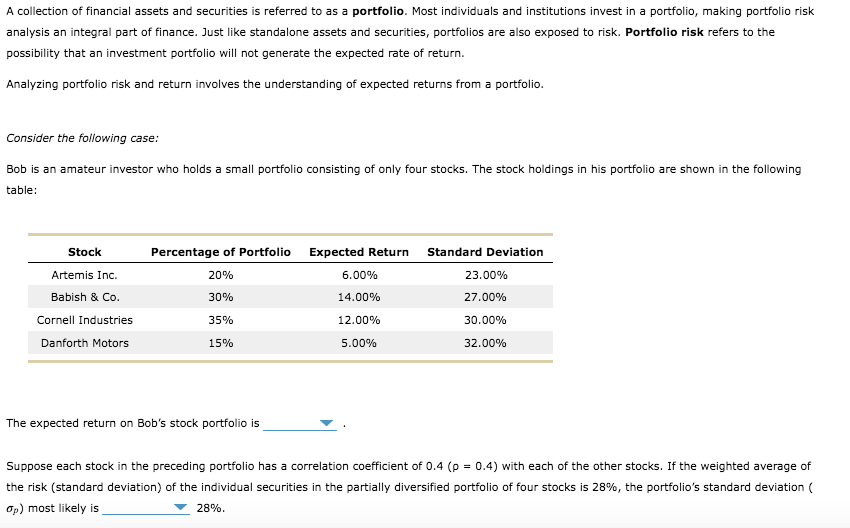

Transcribed Image Text:A collection of financial assets and securities is referred to as a portfolio. Most individuals and institutions invest in a portfolio, making portfolio risk analysis an integral part of finance. Just like standalone assets and securities, portfolios are also exposed to risk. Portfolio risk refers to the possibility that an investment portfolio will not generate the expected rate of return.
Analyzing portfolio risk and return involves the understanding of expected returns from a portfolio.
Consider the following case:
Bob is an amateur investor who holds a small portfolio consisting of only four stocks. The stock holdings in his portfolio are shown in the following table:
| Stock | Percentage of Portfolio | Expected Return | Standard Deviation |
|-------------------|-------------------------|-----------------|-------------------|
| Artemis Inc. | 20% | 6.00% | 23.00% |
| Babish & Co. | 30% | 14.00% | 27.00% |
| Cornell Industries| 35% | 12.00% | 30.00% |
| Danforth Motors | 15% | 5.00% | 32.00% |
The expected return on Bob’s stock portfolio is ________________ .
Suppose each stock in the preceding portfolio has a correlation coefficient of 0.4 (ρ = 0.4) with each of the other stocks. If the weighted average of the risk (standard deviation) of the individual securities in the partially diversified portfolio of four stocks is 28%, the portfolio’s standard deviation (σₚ) most likely is ________________ 28%.
Expert Solution
This question has been solved!
Explore an expertly crafted, step-by-step solution for a thorough understanding of key concepts.

This is a popular solution

Trending nowThis is a popular solution!

Step by stepSolved in 2 steps with 1 images

Knowledge Booster

Similar questions
- 6.36. Suppose that for a given computer salesperson, the probability distribution of x = the number of systems sold in 1 week is given by the following table: 1 2 3 4 7 8 p(z) 0.05 0.10 0.12 0.30 0.30 0.11 0.01 0.01 a. Find the mean value of æ (the mean number of systems sold). b. Find the variance and standard deviation of æ. How would you interpret these values? c. What is the probability that the number of systems sold is within 1 standard deviation of its mean value? d. What is the probability that the number of systems sold is more than 2 standard deviations from the mean?arrow_forwardIf the average low temperature of a winter month in Rochester, NY is 18∘18∘ and the standard deviation is 3.4∘3.4∘, then according to Chebyshev's theorem, the percentage of average low temperatures in Rochester, NY between 12.56∘12.56∘ and 23.44∘23.44∘ is at least %.arrow_forward(a) The population 3, 4, 9, 14, and 20 has a mean of 10 and a standard deviation of 6.356. The z-scores for each of the five data values are z3 ≈ −1.101, z4 ≈ −0.944, z9 ≈ −0.157, z14 ≈ 0.629, and z20 ≈ 1.573. Find the mean and the standard deviation of these z-scores. mean standard deviation (b) The population 2, 6, 12, 17, 22, and 25 has a mean of 14 and a standard deviation of 8.226. The z-scores for each of the six data values are z2 ≈ −1.459, z6 ≈ −0.973, z12 ≈ −0.243, z17 ≈ 0.365, z22 ≈ 0.973, and z25 ≈ 1.337. Find the mean and the standard deviation of these z-scores. mean standard deviation (c) Use the results of part (a) and part (b) to make a conjecture about the mean and standard deviation of the z-scores for any set of data. The mean of the z-scores is always 1, and their standard deviation is 0. The mean of the z-scores is always 1 more than the standard deviation. The mean and standard deviation of z-scores are never the same.…arrow_forward
- Which of the following is true regarding weak correlation coefficients? a. They indicate a slight causation between variables. b. They are found only with Pearson r coefficients. c. They may be the result of restricted range for one of the variables. d. They are rarely found in social science research.arrow_forwardConsider the following set of data. (22, 8), (31, 48), (61, 34), (79, 24), (107, 61), (116, 14)(a) Calculate the covariance of the set of data. (Give your answer correct to two decimal places.)(b) Calculate the standard deviation of the six x-values and the standard deviation of the six y-values. (Give your answers correct to three decimal places.) sx = sy = (c) Calculate r, the coefficient of linear correlation, for the data in part (a). (Give your answer correct to two decimal places.)arrow_forwardSuppose that the index model for stocks A and B is estimated from excess returns with the following results: RA= 2.0% + 0.40RM + eA RB = -1.8%+ 0.9RM + eB OM = 15%; R-squareA = 0.30; R-squareB = 0.22 What is the standard deviation of each stock? Note: Do not round intermediate calculations. Round your answers to 2 decimal places. Stock A Stock B Standard Deviation % %arrow_forward
arrow_back_ios
arrow_forward_ios
Recommended textbooks for you
- MATLAB: An Introduction with ApplicationsStatisticsISBN:9781119256830Author:Amos GilatPublisher:John Wiley & Sons Inc
 Probability and Statistics for Engineering and th...StatisticsISBN:9781305251809Author:Jay L. DevorePublisher:Cengage Learning
 Statistics for The Behavioral Sciences (MindTap C...StatisticsISBN:9781305504912Author:Frederick J Gravetter, Larry B. WallnauPublisher:Cengage Learning
  Elementary Statistics: Picturing the World (7th E...StatisticsISBN:9780134683416Author:Ron Larson, Betsy FarberPublisher:PEARSON
 The Basic Practice of StatisticsStatisticsISBN:9781319042578Author:David S. Moore, William I. Notz, Michael A. FlignerPublisher:W. H. Freeman
 Introduction to the Practice of StatisticsStatisticsISBN:9781319013387Author:David S. Moore, George P. McCabe, Bruce A. CraigPublisher:W. H. Freeman
MATLAB: An Introduction with Applications
Statistics
ISBN:9781119256830
Author:Amos Gilat
Publisher:John Wiley & Sons Inc
Probability and Statistics for Engineering and th...
Statistics
ISBN:9781305251809
Author:Jay L. Devore
Publisher:Cengage Learning
Statistics for The Behavioral Sciences (MindTap C...
Statistics
ISBN:9781305504912
Author:Frederick J Gravetter, Larry B. Wallnau
Publisher:Cengage Learning
Elementary Statistics: Picturing the World (7th E...
Statistics
ISBN:9780134683416
Author:Ron Larson, Betsy Farber
Publisher:PEARSON
The Basic Practice of Statistics
Statistics
ISBN:9781319042578
Author:David S. Moore, William I. Notz, Michael A. Fligner
Publisher:W. H. Freeman
Introduction to the Practice of Statistics
Statistics
ISBN:9781319013387
Author:David S. Moore, George P. McCabe, Bruce A. Craig
Publisher:W. H. Freeman