Concept explainers
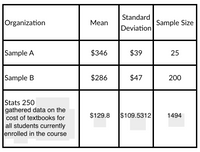
The Office of Financial Aid has historical data that indicates the standard deviation of textbook costs is steady from semester to semester at $287. Please use the info provided to answer the 3 subquestions:
1.a) If the true textbook cost is $524, what is the z-score and corresponding probability that you’d get a sample with a
1.b) Using this probability, does the reported value of $524 seem reasonable?
1.c) Should the administrators adjust the value? Justify your recommendation using the statistical support provided


Since, the question is not properly specified and does not provide a lot of information, the work is done on the basis of intuition, depending upon the information provided.
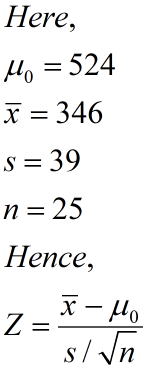
We see that, true text book cost is $524.

Trending nowThis is a popular solution!
Step by stepSolved in 3 steps with 2 images

- "If the mean of a dataset is 50 and the standard deviation is 5, what is the z-score of the value 55? A. -1 B. O C. 1 D. 2"arrow_forwardThe latest available data showed health care spending were $8086 per person in the United States (17.6% of GDP). Use $8086 as the population mean and $2500 as the population standard deviation. Suppose a survey firm will take a sample of 100 people to investigate their health care spending What is the sampling distribution of the mean amount of health care spending for the sample of 100 people? (i.e. shape, mean, sd) What is the probability the sample mean will be within +$200 of the population mean?arrow_forwardAccording to the U.S. Census, the average adult woman is the United States is 65 inches tall and the standard deviation is 3 inches. If Zsike is 67 inches tall, what is her z-score?arrow_forward
- please answer asaparrow_forwardwhat measure of variability is to be computed with a medianarrow_forwardIf the mean speed for a major league fast ball is 90 miles per hour and the standard deviation is 5 miles per hour, what would the standardized score be for a pitch that is 97 miles per hour? O 0.4 4.0 1.4 O 1.0arrow_forward
- Consider the data from the Anthropology 105 class. The mean for women is 64.33 in and the standard deviation is 2.64 in. The average height of men in the US is approximately 5ft 10in. What proportion of women represented here are shorter than the average man?arrow_forwardThe average home in the US is expected to cost $240,000. A random sample of 56 homes sold this month showed average price of $232,000. Assume you have access to this data. We are interested in determining cost if the cost of average home has decreased this month. If the test statistic is -1.66 what is the p-value?arrow_forwardWhich of these is an advantage of using a transformed score when reporting the score of an individual case? a. Transformed scores will allow the mean score to be reported. b. Transformed scores will be reported on the nominal level. c. Transformed scores provide a context for the individual's score d. Transformed scores provide a measure of variability.arrow_forward
- when computing descriptive statistics, we are interested only both describing our data and also in presenting the means and standard deviations of all dependent variables. True or false When writing your participant section, you include all measures of central tendency (mean, median, mode) and all measures of variablility (variance, range, standard deviation). True or falsearrow_forwardConsider the following data of 10 exams scores: 28, 57, 58, 64, 69, 74, 79, 80, 83, 85 1. The the mean, median, and mode 2. find the standard deviation without a graphing calculator. Show all your computationsarrow_forwardCan the measure of central tendency tell a researcher how spread out the scores are in a distribution?arrow_forward
 MATLAB: An Introduction with ApplicationsStatisticsISBN:9781119256830Author:Amos GilatPublisher:John Wiley & Sons Inc
 Probability and Statistics for Engineering and th...StatisticsISBN:9781305251809Author:Jay L. DevorePublisher:Cengage Learning
 Statistics for The Behavioral Sciences (MindTap C...StatisticsISBN:9781305504912Author:Frederick J Gravetter, Larry B. WallnauPublisher:Cengage Learning
 Elementary Statistics: Picturing the World (7th E...StatisticsISBN:9780134683416Author:Ron Larson, Betsy FarberPublisher:PEARSON
 The Basic Practice of StatisticsStatisticsISBN:9781319042578Author:David S. Moore, William I. Notz, Michael A. FlignerPublisher:W. H. Freeman
 Introduction to the Practice of StatisticsStatisticsISBN:9781319013387Author:David S. Moore, George P. McCabe, Bruce A. CraigPublisher:W. H. Freeman


