ENGR.ECONOMIC ANALYSIS
14th Edition
ISBN: 9780190931919
Author: NEWNAN
Publisher: Oxford University Press
expand_more
expand_more
format_list_bulleted
Question

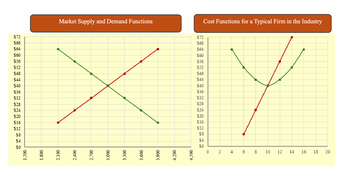
Transcribed Image Text:1.500
$72
$68
$64
$60
$56
$52
$48
$44
$40
$36
$32
$28
$24
$20
$16
$12
$8
$4
$0
1,800
2,100
2,400
2,700
3.000
3.300
3.600
3,900
Market Supply and Demand Functions
$72
$68
$64
$60
$56
$52
$48
$44
$40
Cost Functions for a Typical Firm in the Industry
XY
$36
$32
$28
$24
$20
$16
$12
4,200
4,500
$4
$0
0
2
4
6 8
10
12
14
16
18
20

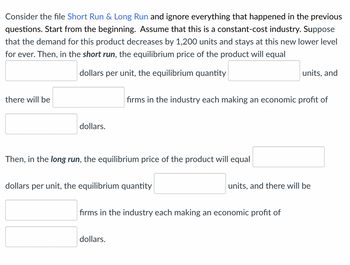
Transcribed Image Text:Consider the file Short Run & Long Run and ignore everything that happened in the previous
questions. Start from the beginning. Assume that this is a constant-cost industry. Suppose
that the demand for this product decreases by 1,200 units and stays at this new lower level
for ever. Then, in the short run, the equilibrium price of the product will equal
there will be
dollars per unit, the equilibrium quantity
units, and
firms in the industry each making an economic profit of
dollars.
Then, in the long run, the equilibrium price of the product will equal
dollars per unit, the equilibrium quantity
units, and there will be
firms in the industry each making an economic profit of
dollars.
Expert Solution
This question has been solved!
Explore an expertly crafted, step-by-step solution for a thorough understanding of key concepts.
Step by stepSolved in 2 steps

Knowledge Booster
Similar questions
- Table Cost.EX2.2: Data for a Competitive Firm Marginal Marginal Output Cost Revenue (Q) (MC) (MR) 1 $3.50 $7.00 $4.50 $7.00 3 $5.50 $7.00 4 $6.50 $7.00 $7.50 $7.00 Refer to Table Cost.EX2.2. According the marginal cost (MC) and marginal revenue (MR) rule of profit maximization, the maximum economic profit is about $8.50 $7.00 $5.50 $8.00arrow_forwardRefer to the table below. The table shows Long-Run Total Costs Quantity 1 2 5 7 Firm 1 $180 $280 $470 $680 $890 $1,200 $1,510 Firm 2 $120 $250 $390 $540 $700 $870 $1,050 Firm 3 $150 $300 $450 $600 $750 $900 $1,050 Firm 4 $210 $340 $490 $620 $850 $1,060 $1,290 Firm 4's efficient scale occurs at what quantity? 5 4 O O O Oarrow_forwardHand written solutions are strictly prohibitedarrow_forward
- I need answer of second part and only handwritten otherwise i will dislikearrow_forwardTotal Output 1 2 3 4 5 6 7 80 9 10 A B 8 D $20; $27.33 $10; $10.40 $24; $27.33 Price $30; $20.50 $100 90 80 70 60 50 40 30 20 Marginal Revenue 10 $100 80 60 40 20 -20 -40 -60 Average Total Cost -80 $100.00 63.00 52.67 49.50 49.60 50.00 52.29 55.75 60.67 67.60 130 Refer to the data for a nondiscriminating monopolist. At its profit-maximizing output, this firm's price will exceed its marginal cost and its average total cost by_ by $30 26 32 Marginal Cost 40 50 52 66 80 100arrow_forwardMarket Representative Firm MC АТС $8 AVC A $6 MR = P %3D D1 20,000 100 125 Quantity (Q) Output (Q) The diagram above depicts overall market supply and demand on the left, and the cost curves for a representative firm supplying in that market on the right. When the market reaches its Long Run Equilibrium, we should expect the firm to produce and the equilibrium quantity in the market to be 125; less than 20,000 125; more than 20,000 100; less than 20,000 O 100; more than 20,000 Pricearrow_forward
- Table Cost.EX2: Costs and Outputs for a Competitive Firm Total Total Output Fixed Variable (Q) Costs (TFC) Costs (TVC) $40.00 $0.00 1 $40.00 $40.00 $40.00 $90.00 $40.00 $130.00 4 $40.00 $190.00 5 $40.00 $260.00 Refer to Table Cost.EX2. At 3 units of output, average variable cost and average total cost are and respectively. $47.50; $70.00 O $47.50; $56.67 $43.33; $70.00 $43.33; $56.67arrow_forward$150 $145 $140 MC $135 $130 $125 $120 $115 ATC $110 $105 $100 $95 $90 $85 $80 AVC $75 $70 $65 $60 $55 $50 $45 $40 $35 $30 $25 0 1 2 3 5 6 Quantity Produced 7 8 9 10 11 The graph above shows the cost functions for a perfectly competitive profit maximizing firm. If the market price of the product is $70 per unit, the firm will produce units, will cover make an economic profit of dollars. dollars of its fixed cost, and willarrow_forwardD) Granite Tops for You uses 15 units of capital at $5,000 per unit and employs 50 employees at a cost of $500 each. What is the company's fixed cost? A) $250,000 B) $500 C) $75,000 Which of the following is used to measure market structure and performance? B) Four-firm concentration ratio A) Eight-firm concentration ratio C) HHI (Herfindahl-Hirschman index) D) All of the answers are correct. An industry is comprised of 40 firms, each with an equal market share. What is the four-firm concentration B) 0.1 ratio of this industry? A) 02 C) 0.3 D) 0.4 D) $5,000 tly competitive market, then it will most likelyarrow_forward
- Dollars A B C 0 KDE Quantity A) K units at price C B) E units at price B H C) E units at price A F D) D units at price J Refer to the above diagram. To maximize profit or minimize losses this firm will produce: MC ATC AVC -MRarrow_forward2. For the following total revenue and total cost functions of a firm: TR = 800Q – 10Q2 TC = (2/3)Q3 -30Q2 + 672Q +4000 (a) Determine the level of output at which the firm maximizes total profit (b) Calculate the profit (need step by step, please)arrow_forwardlawn-mowing services. Table Q2(a) sets out Lisa's costs and revenue at the market price of RM30 a lawn: Quantity (lawn per hour) Table Q2(a): Costs and Revenues of Lisa’s Lawn Company Marginal Revenue Total Total Cost (RM) Marginal Cost Revenue (RM) (RM) (RM) 30 1 30 30 40 10 60 90 30 30 55 15 3 75 20 4 120 30 100 25 5 150 30 130 30 6. 180 30 165 35 (i) Identify the quantity of lawn per hour that maximised the profit earned by the firm. (ii) Calculate the amount of Lisa's maximum profit in the short run. (iii) In the long run a firm in perfect competition makes normal profit which is equal to zero. Explain graphically how free entry and exit brings the economic profit back to normal profit.arrow_forward
arrow_back_ios
SEE MORE QUESTIONS
arrow_forward_ios
Recommended textbooks for you

 Principles of Economics (12th Edition)EconomicsISBN:9780134078779Author:Karl E. Case, Ray C. Fair, Sharon E. OsterPublisher:PEARSON
 Engineering Economy (17th Edition)EconomicsISBN:9780134870069Author:William G. Sullivan, Elin M. Wicks, C. Patrick KoellingPublisher:PEARSON
 Principles of Economics (MindTap Course List)EconomicsISBN:9781305585126Author:N. Gregory MankiwPublisher:Cengage Learning
 Managerial Economics: A Problem Solving ApproachEconomicsISBN:9781337106665Author:Luke M. Froeb, Brian T. McCann, Michael R. Ward, Mike ShorPublisher:Cengage Learning
 Managerial Economics & Business Strategy (Mcgraw-...EconomicsISBN:9781259290619Author:Michael Baye, Jeff PrincePublisher:McGraw-Hill Education


Principles of Economics (12th Edition)
Economics
ISBN:9780134078779
Author:Karl E. Case, Ray C. Fair, Sharon E. Oster
Publisher:PEARSON

Engineering Economy (17th Edition)
Economics
ISBN:9780134870069
Author:William G. Sullivan, Elin M. Wicks, C. Patrick Koelling
Publisher:PEARSON

Principles of Economics (MindTap Course List)
Economics
ISBN:9781305585126
Author:N. Gregory Mankiw
Publisher:Cengage Learning

Managerial Economics: A Problem Solving Approach
Economics
ISBN:9781337106665
Author:Luke M. Froeb, Brian T. McCann, Michael R. Ward, Mike Shor
Publisher:Cengage Learning

Managerial Economics & Business Strategy (Mcgraw-...
Economics
ISBN:9781259290619
Author:Michael Baye, Jeff Prince
Publisher:McGraw-Hill Education