
Algebra and Trigonometry (6th Edition)
6th Edition
ISBN: 9780134463216
Author: Robert F. Blitzer
Publisher: PEARSON
expand_more
expand_more
format_list_bulleted
Related questions
Concept explainers
Question
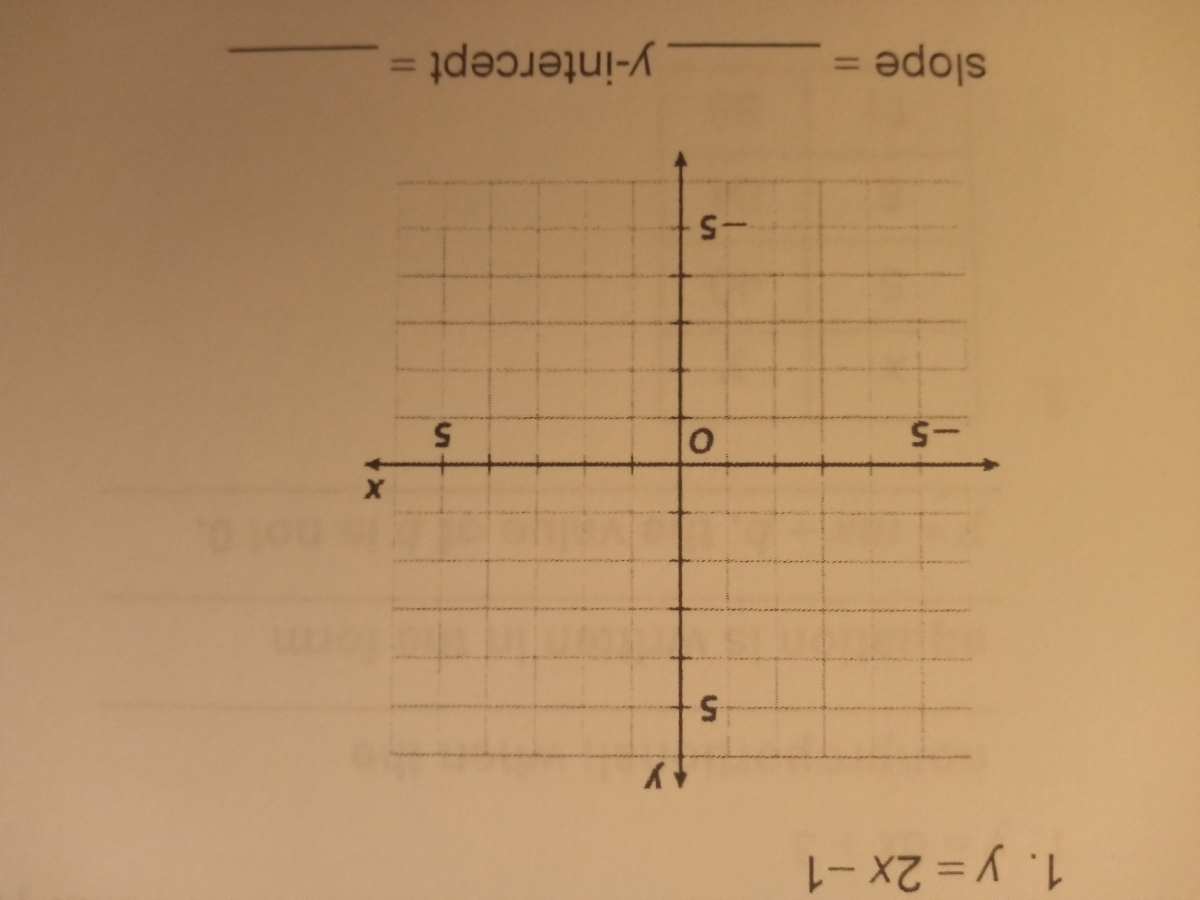

Transcribed Image Text:**Graph and Equation Explanation for Educational Purposes**
### Image Transcription:
1. **Equation:**
- \( y = 2x - 1 \)
- Presented in a linear form, indicating a straight line graph.
2. **Formula for Slope and Intercept:**
- Slope = \(\frac{\text{rise}}{\text{run}}\)
- \( y\)-intercept = \((0, b)\) which in this case refers to the constant in the equation.
### Diagram Details:
**Graph:**
- **Axes:**
- **X-axis (horizontal):** Labeled with increments of 5, spanning from -5 to 5.
- **Y-axis (vertical):** Labeled similarly to the X-axis with increments of 5, both positive and negative.
- The central point of intersection is marked as \(O\).
- **Grid:**
- A square grid layout providing a coordinate plane for plotting.
**Understanding the Graph:**
- This graph is set up to plot the linear equation \( y = 2x - 1 \).
- The slope of this line is 2, indicating it rises by 2 units for every 1 unit it moves horizontally to the right.
- The y-intercept is -1, showing where the line crosses the y-axis.
This setup is essential for understanding linear functions and how changes in slope and y-intercept affect the graph's position and orientation.
Expert Solution
This question has been solved!
Explore an expertly crafted, step-by-step solution for a thorough understanding of key concepts.

Step by stepSolved in 2 steps with 1 images

Knowledge Booster


Learn more about
Need a deep-dive on the concept behind this application? Look no further. Learn more about this topic, algebra and related others by exploring similar questions and additional content below.Similar questions
Recommended textbooks for you
- Algebra and Trigonometry (6th Edition)AlgebraISBN:9780134463216Author:Robert F. BlitzerPublisher:PEARSON
 Contemporary Abstract AlgebraAlgebraISBN:9781305657960Author:Joseph GallianPublisher:Cengage Learning
 Linear Algebra: A Modern IntroductionAlgebraISBN:9781285463247Author:David PoolePublisher:Cengage Learning
  Algebra And Trigonometry (11th Edition)AlgebraISBN:9780135163078Author:Michael SullivanPublisher:PEARSON
 Introduction to Linear Algebra, Fifth EditionAlgebraISBN:9780980232776Author:Gilbert StrangPublisher:Wellesley-Cambridge Press
 College Algebra (Collegiate Math)AlgebraISBN:9780077836344Author:Julie Miller, Donna GerkenPublisher:McGraw-Hill Education
Algebra and Trigonometry (6th Edition)
Algebra
ISBN:9780134463216
Author:Robert F. Blitzer
Publisher:PEARSON
Contemporary Abstract Algebra
Algebra
ISBN:9781305657960
Author:Joseph Gallian
Publisher:Cengage Learning
Linear Algebra: A Modern Introduction
Algebra
ISBN:9781285463247
Author:David Poole
Publisher:Cengage Learning
Algebra And Trigonometry (11th Edition)
Algebra
ISBN:9780135163078
Author:Michael Sullivan
Publisher:PEARSON
Introduction to Linear Algebra, Fifth Edition
Algebra
ISBN:9780980232776
Author:Gilbert Strang
Publisher:Wellesley-Cambridge Press
College Algebra (Collegiate Math)
Algebra
ISBN:9780077836344
Author:Julie Miller, Donna Gerken
Publisher:McGraw-Hill Education